Average UK Household Budget 2024
On average, NimbleFins experts estimate that UK households spend £628 per week (£2,700 a month) to cover living expenses including a roof over our heads, food in our bellies, clothes on our backs, and transport to and from work or school—but costs are higher if you rent or have a mortgage.
In order to better understand average spending levels across these major categories, and more, our experts have analyzed data from the Living Costs and Food Survey from the Office of National Statistics (ONS)—and ramped these figures up by inflation across each category and subcategory to estimate spending, assuming people maintain the same standard of living. When the latest figures are released later in the spring of 2024, we will update the figures accordingly.
Depending on where you live, your stage of life, and your financial circumstances, you may also be spending extra on childcare, college tuition or health care. If you're hoping to make your budget stretch further, read about 10 ways to reduce your monthly expenses.
- Average Household Budget
- Housing & Household Expenditures
- Transportation Costs
- Food Costs & Other
- Savings
Note: The figures in this article come from the Office for National Statistics and reflect average spending across all households, combining households that do and do not spend on a given line item. As a result, you may notice that some figures don't accurately reflect the true cost for a user. If any particular line items jump out at you in this regard, please kindly let us know in the comments and we will try to address the limitations of the ONS data with further explanation, analysis or colour.
Average Household Budget in the UK
In early 2024, the average UK household budget is around £2,700 a month (or £33,000 a year) based on an average of 2.3 people per household, according to NimbleFins analysis of ONS Family Spending data. But your housing situation can mean you spend a lot more or less.
Where does the typical household budget go? Brits spend the most on transportation, housing and food. In fact, 13% of our household budgets goes towards transportation, up to 36% towards rent or 55% on mortgage interest payments and 12% to feed ourselves. Here's how the average household budget breaks down by category, on a weekly, monthly and annual basis:
| Average Household Expenditures | Weekly Outgoings | Monthly Outgoings | Annual Outgoings | % of Budget | |
|---|---|---|---|---|---|
| Housing (e.g., rent, mortgage interest payments, repairs, etc.) | £92 | £400 | £4,806 | 15% | |
| Owned outright (repairs and maintenance) | £11 | £46 | £550 | 2% | |
| Social rented | £114 | £493 | £5,921 | 18% | |
| Private rented | £225 | £973 | £11,675 | 36% | |
| Own with a mortgage (including repairs) | £343 | £1,485 | £17,816 | 55% | |
| Transport | £81 | £351 | £4,214 | 13% | |
| Food and non-alcoholic drinks | £78 | £336 | £4,038 | 12% | |
| Utilities (water, gas, electric) | £62 | £270 | £3,245 | 10% | |
| Recreation and culture (e.g., pets, gym fees, TV, etc.) | £44 | £189 | £2,262 | 7% | |
| Restaurants and hotels | £40 | £174 | £2,088 | 6% | |
| Household (e.g., furniture, linens, appliances, etc.) | £40 | £172 | £2,065 | 6% | |
| Council Tax | £32 | £139 | £1,674 | 5% | |
| Communications and TV/video services | £30 | £130 | £1,566 | 5% | |
| Insurance | £23 | £100 | £1,203 | 4% | |
| Clothing and footwear | £20 | £85 | £1,021 | 3% | |
| Personal (e.g., toiletries, jewellery, sunglasses, etc.) | £17 | £72 | £862 | 3% | |
| Money transfers and credit (e.g., cash gifts) | £15 | £66 | £790 | 2% | |
| Vices (e.g., alcohol, tobacco, etc.) | £14 | £59 | £713 | 2% | |
| Package holidays | £12 | £52 | £627 | 2% | |
| Health | £10 | £43 | £515 | 2% | |
| Other | £8 | £33 | £400 | 1% | |
| Education | £5 | £24 | £285 | 1% | |
| Licences, fines and transfers (e.g., stamp duty, road tax) | £4 | £17 | £208 | 1% | |
| Holiday spending | £1 | £6 | £73 | 0% | |
| Total Spending | £628 | £2,721 | £32,655 | 100% | |
Average Monthly Household Spending
The average UK household spends £2,721 a month on household bills—according to the average (and unlikely!) household size of 2.3 people. However this figure averages all households (including those with no rent or mortgage expenses)—so housing costs would be lower for those owning a home outright and higher for those with a mortgage or renting, as you can see in the table and chart below (in green).

| Approx. Average Monthly Budget, by household type | Average Household (2.3 people) |
|---|---|
| Social Renters | £2,625 |
| Private Renters | £3,104 |
| Mortgage | £3,616 |
| Outright Homeowners | £2,177 |
Average Cost of UK Housing
The average UK household spends nearly £9,800 on utilities, communications & TV services and other household operational and maintenance expenses like insurance and council tax, as well as household goods & services per year.
In addition to this, many household spend on rent and mortgage payments. Of those renting, the average monthly rent in the UK is now around £973 for private renters and £493 for social renters. The average spent on mortgage payments would now be a whopping £1,485 a month.
A full breakdown of average housing expenses is illustrated in the chart below.
To see how much the average household spends on household goods & services like furniture, furnishings and appliances, please see our related article Who Spends the Most Making a House a Home? which breaks down how much we spend according to age.
| Breakdown of UK Housing Costs per household | Weekly | Monthly | Annual |
|---|---|---|---|
| Rent for Households Renting from Housing Association/Local Authority | £114 | £493 | £5,921 |
| Rent for Households Renting Privately | £225 | £973 | £11,675 |
| Mortgage Payments for Households with a Mortgage | £332 | £1,439 | £17,266 |
| Utilities (water, gas & electric) | £40 | £172 | £2,065 |
| Communications and TV/video services (internet, landline, TV subscriptions, etc.) | £20 | £85 | £1,021 |
| Household Goods & Services | £40 | £174 | £2,088 |
| Council Tax | £23 | £100 | £1,203 |
| Maintenance & Repairs (excl. capital improvements) | £11 | £46 | £550 |
| Home Insurance | £6 | £27 | £327 |
| Total Housing Costs per Social Renting Household | £253 | £1,098 | £13,175 |
| Total Housing Costs per Privately Renting Household | £364 | £1,577 | £18,928 |
| Total Housing Costs per Household with Mortgage | £472 | £2,043 | £24,519 |
| Total Housing Costs per Household Owning Outright | £139 | £604 | £7,254 |
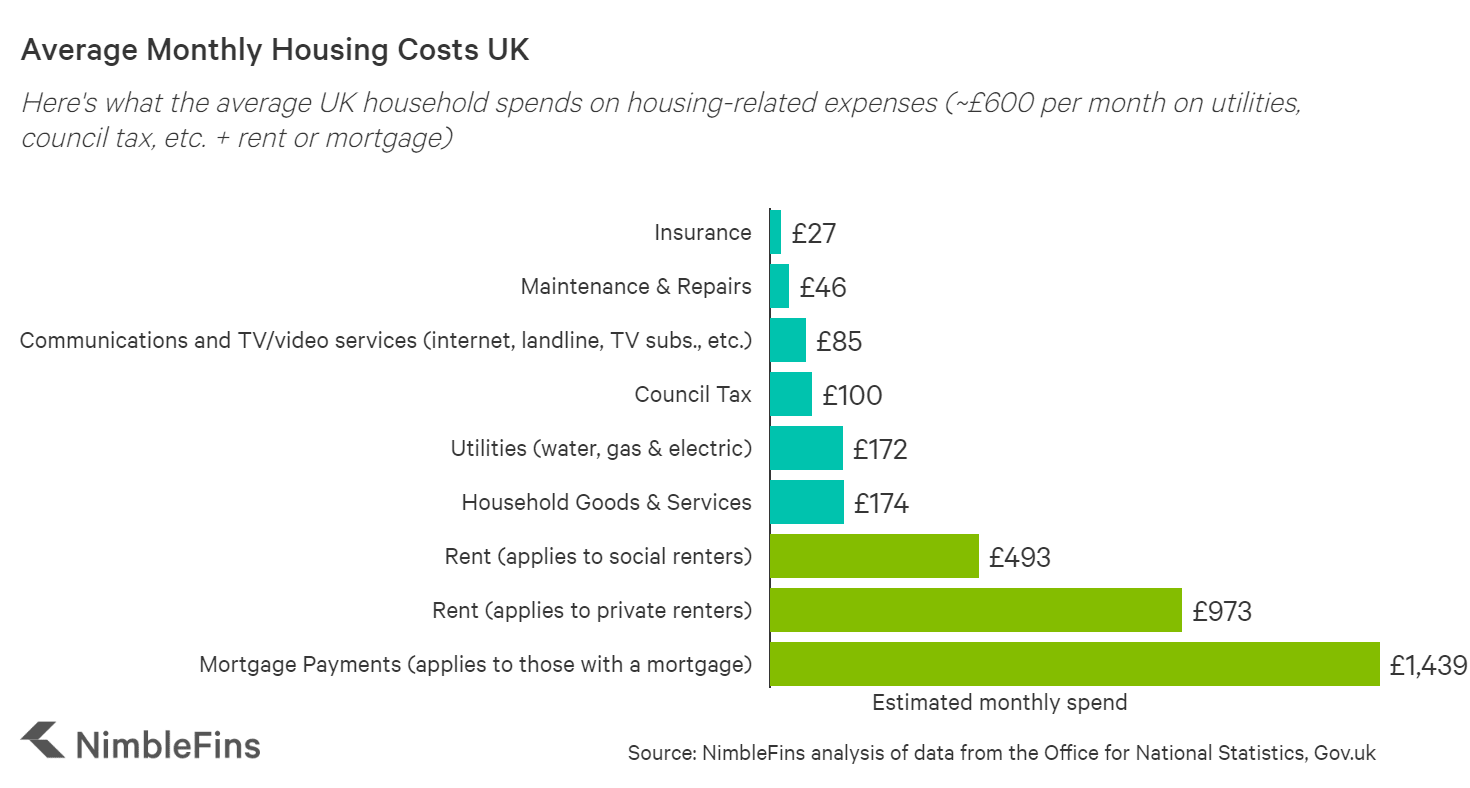
If you rent or pay a mortgage, total costs for a regular roof over your head now are estimated to eat up around 55% (!) of an average UK household’s expenses, give or take. While the largest component of housing costs is rent or mortgage interest, a close second is the cost of utilities including internet, TV and phones. The cost of gas & electric has plagued both businesses and households for over a year now. And there are no more deals to be found by switching energy supplier.
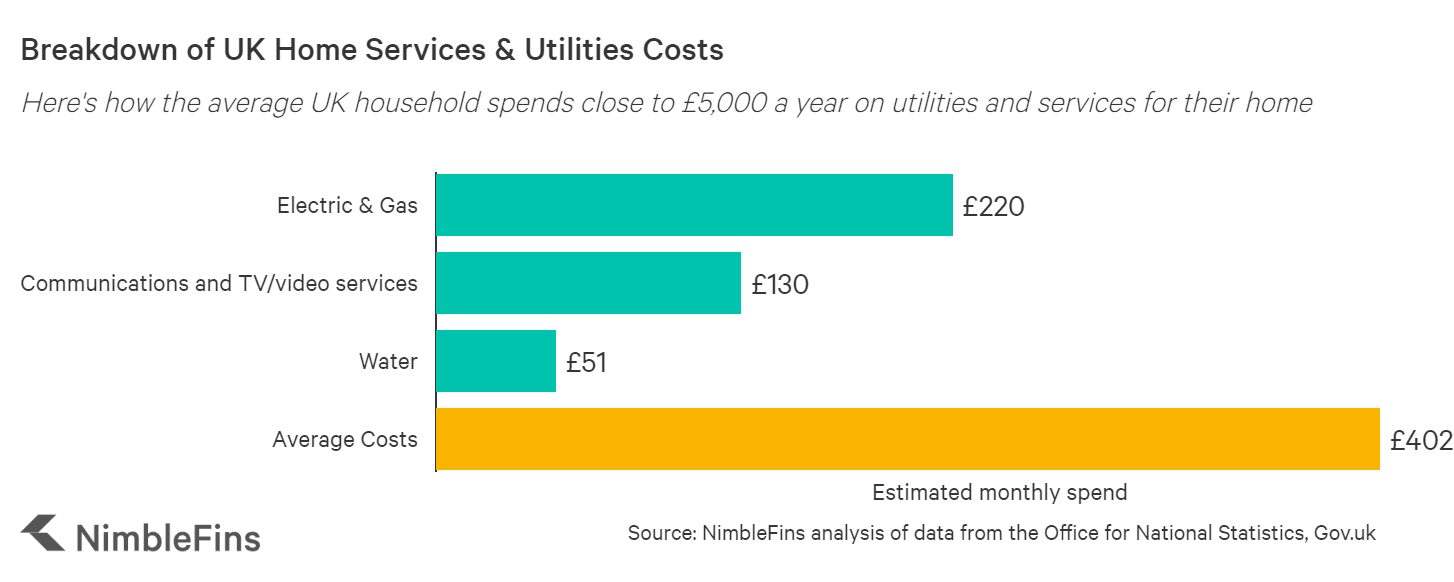
| Breakdown of Home Services & Utilities Costs per household | Weekly | Monthly | Annual |
|---|---|---|---|
| Electric & Gas | £50.79 | £220 | £2,641 |
| Communications and TV/video services (TV Subscriptions, streaming services, landline and mobile phones, internet, etc.) | £30.11 | £130 | £1,566 |
| Water | £11.81 | £51 | £614 |
| Average Costs | £92.71 | £402 | £4,821 |
Note, those figures reflect previous energy costs, which have since fallen. As of April 2024, the average household energy bill is around £1,690.
In addition to energy becoming more expensive, households are now paying more for their water bills.
Cheap Home Insurance in Your Area
Quickly compare up to 50 UK insurance providers. Save up to £151.* Powered by QuoteZone.
Average UK Transportation Costs
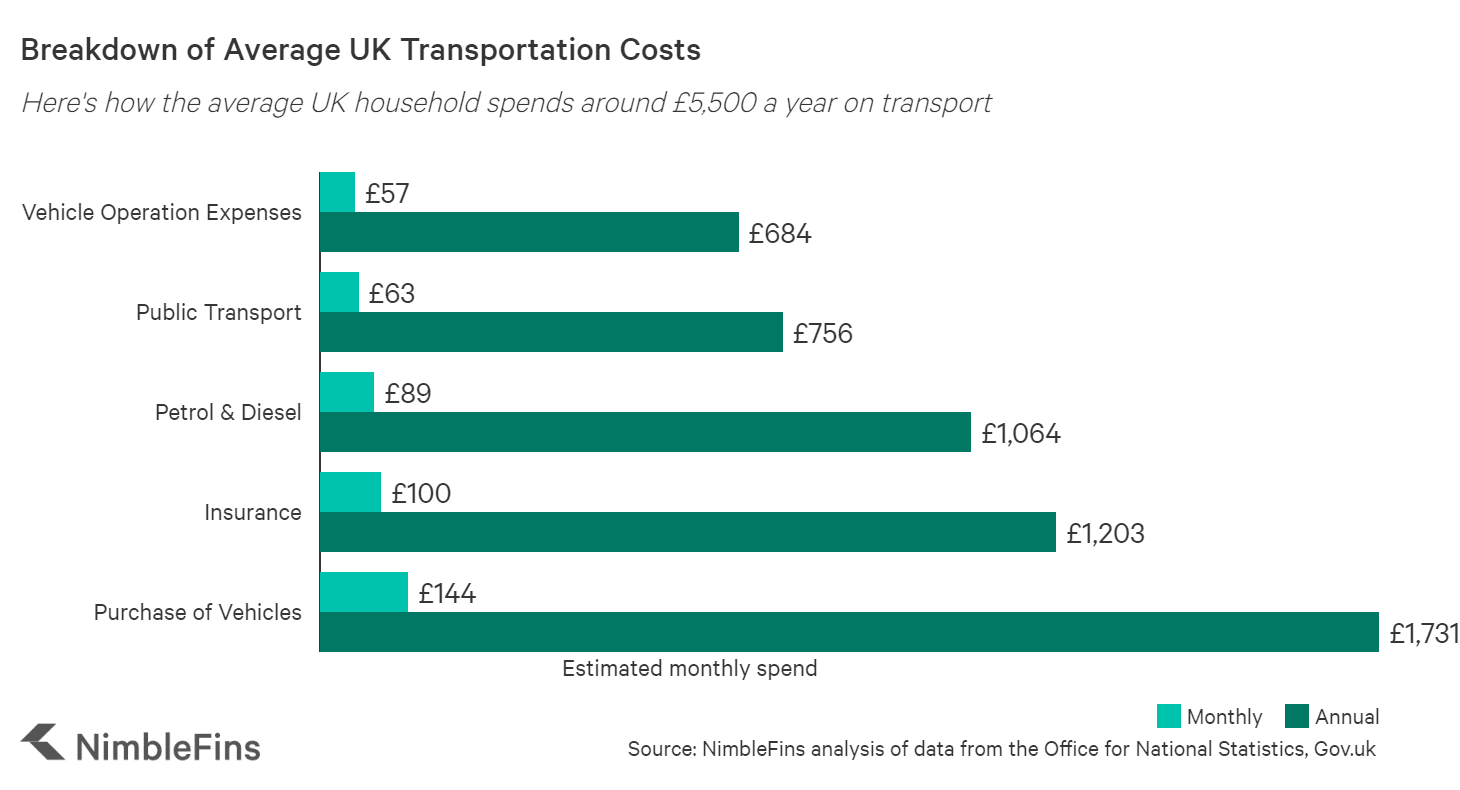
The second largest cost for the average UK household, behind housing & utilities, is transport. Households spend well over £5,000 per year to get around, an increase of around 11% from 2021.
The largest component of our travel budget is operating our personal vehicles. We spend just over £1,500 a year on petrol & diesel per household, and the typical cost of car insurance per household (not per car) is £629 per year (per car, cheap car insurance starts from around £500 per car). The used car market is hot—we spend nearly twice as much money buying used cars than we do on new! On a per-car basis, households spend about £3,500 a year on car running costs, per vehicle.
The average amount spent on public transport is around £1,300 year (£112 a month), which is primarily spent on bus, train and tube rides and international airfare (around £360 per year/£30 a month spent across each category).
| Breakdown of Average UK Transportation Costs per household | Weekly | Monthly | Annual |
|---|---|---|---|
| Vehicle Operation Expenses | £13.1 | £57 | £684 |
| Public Transport | £14.5 | £63 | £756 |
| Petrol & Diesel | £20.5 | £89 | £1,064 |
| Insurance | £23.1 | £100 | £1,203 |
| Purchase of Vehicles | £33.3 | £144 | £1,731 |
| Average Annual Transportation Costs per Household | £104.6 | £453 | £5,438 |
Note discrepancies between total transportation figures and subcategories is due to the application of different inflation figures to subcategories of transport spend and rounding errors. Also, please note that these reflect averages across all UK households—those with and without a car; those who do and do not regularly use public transport. That is, there are households with £0 spending averaged in (e.g. those without a car spend £0 on car purchase or petrol). As a result, those that do have a car or use public transport regularly would certainly spend more than the figures above.
Average UK Food Costs
The third largest household budget category is food. We estimate the average UK household now spend £4,100 a year on groceries and non-alcoholic drinks at home. Another £484 is spent on alcohol (mostly wine) for consumption at home. Eating and drinking out consumes a further £1,320 from our household budgets. All in, food and drink consume around 15% of our total annual budgets, and food prices in the UK are now rising around 10% a year.
While food is, of course, a necessity for life, it’s often considered a fungible category in a household budget. After all, a family could dine on spaghetti with a touch of homemade bolognese, for a low cost meal. Or they could go out to a London hot spot and drop a hundred pounds or more on one dinner.
To gauge a basic minimum for food costs, we can look at the budgets of our poorest households, who are presumably eating as cheaply as they can. Households with disposable incomes less than £11,000 per year still spend around £3,000 annually on food and alcoholic drinks in total. They eat at home more often, spending around 84% of their food & drink budget for consumption at home, with the other 16% of the food budget spent out of the house. The top 10% highest earning households now spend around £5,800 on food & drinks each year, with nearly one third (32%) of the budget spent dining out. For more details, see our related articles Average Annual UK Food Spending and Average Alcohol Spending in the UK.
Average Savings UK
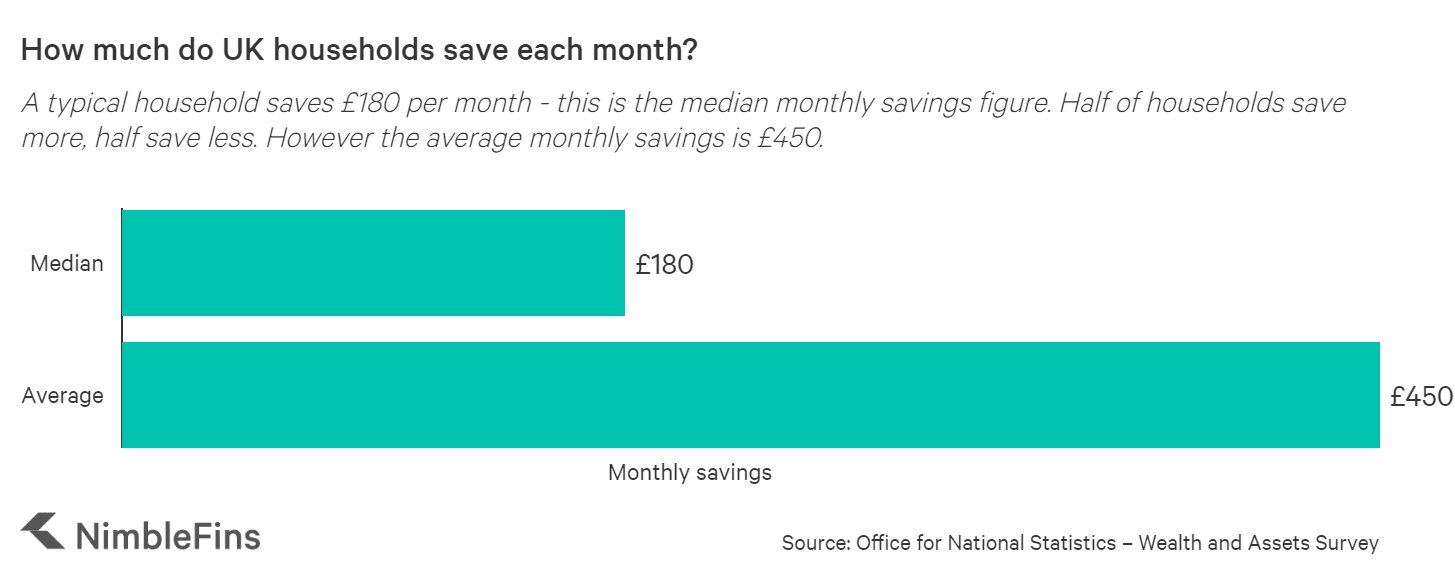
Now that you've spent money on living expenses, what do you do with any leftover money? Save! The typical UK household saves roughly £180 per month—this represents the median amount saved each month. That means that 50% of households save less than £180 a month and 50% of households save more.
The average savings per month UK is £450 per household. This figure is higher than the median figure due to a small number of households with very high savings rates. For example, households in the top quintile of income save an average of £1,817 each month. In contrast, the bottom quintile of earners saves -£352 a month.
| How much do UK households save each month? | |
|---|---|
| Median (50% of households save more than this, 50% save less) | £180 |
| Mean (average) | £450 |
For more information on household savings and wealth, see our new study Average Household Savings & Wealth UK.
Budgeting
Balance transfer credit cards: Five must-knows
- Must pay at least the minimum monthly payment to keep 0% interest rate
- Must pay on time each month to keep 0% interest rate
- Some cards give a shorter 0% period at approval
- A longer 0% period = higher transfer rate (usually)
- There are cards with a 0% interest rate AND a 0% transfer rate
The first step to making a household budget stretch further is arguably understanding where your money is currently going. Once you see what is being spent where, you'll be better able to find areas of your budget that might have some flexibility. For example, if you spend a high proportion of your food budget on takeaways you could limit these to a treat once a week, cooking at home the rest of the time to save money.
To understand your finances you can sit down with pen and paper and go through your bank statements and credit card bills once a month. Alternatively, there are a number of handy tech resources at our disposal these days. For example, Money Dashboard, Emma and Plum are personal finance apps where you can easily view all your accounts and track your spending by category.
Note: Updated in June 2023 to reflect the 2021/22 Living Costs and Food Survey from the ONS, adjusted for inflation. Therefore all figures are estimates.