The guidance on this site is based on our own analysis and is meant to help you identify options and narrow down your choices. We do not advise or tell you which product to buy; undertake your own due diligence before entering into any agreement. Read our full disclosure here.
Average Annual Mileage of Cars in England is Down – Are We Really Driving Less?
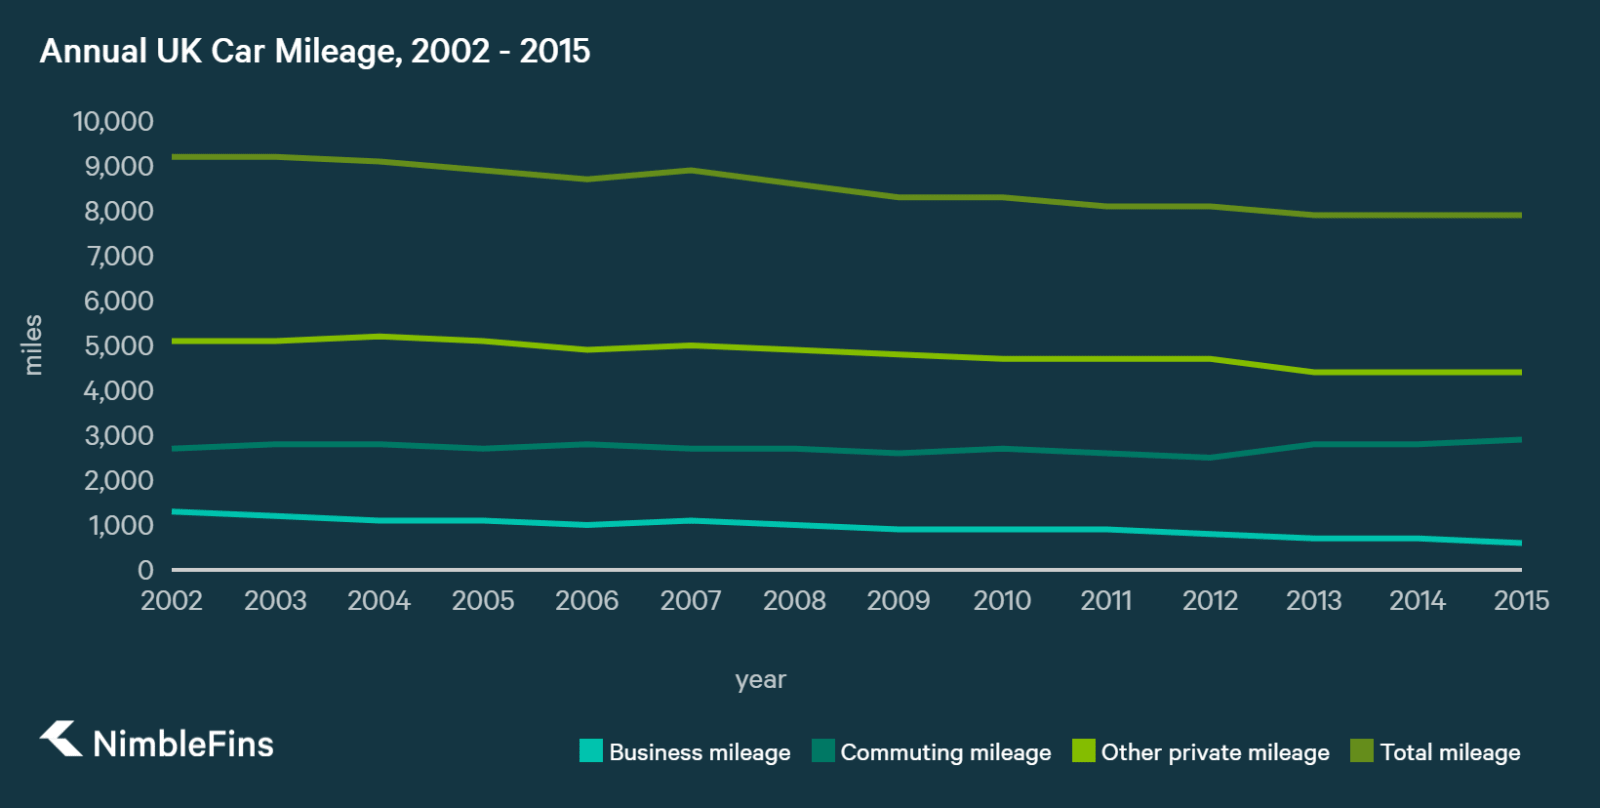
Sometimes there’s more to a statistic than first meets the eye. The latest reports from the Department of Transport indicate that cars in England drove an average of 7,900 miles per year in 2015, down 15% from 9,200 miles per year in 2002. This might lead to you believe that Brits are driving less, but a delve into some other data on new car registrations and road use disputes this conclusion – we are driving more, not less.
More Cars on the Road
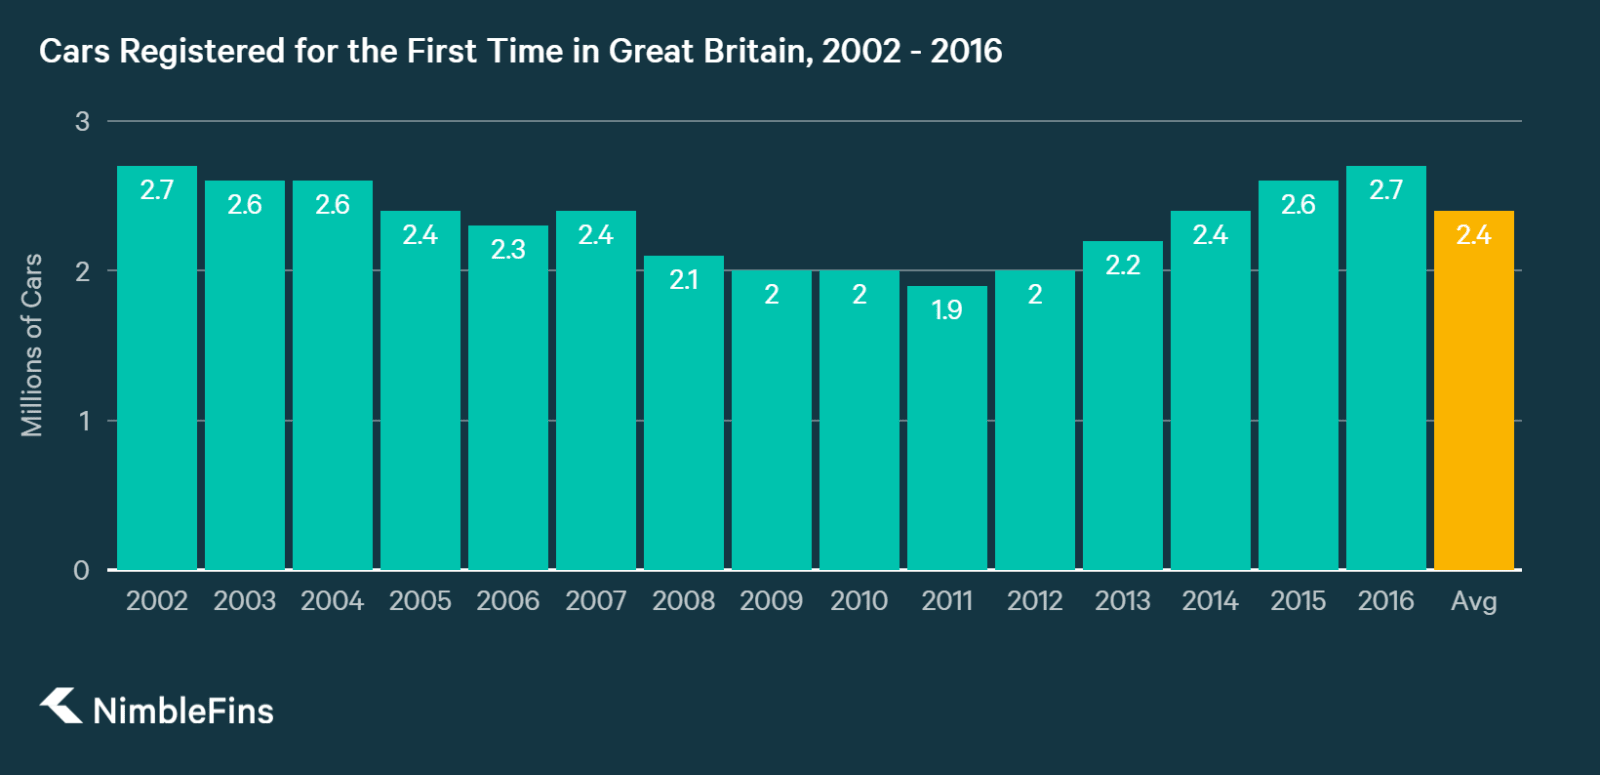
We may be driving less per vehicle but there are more cars on the road than ever before. The number of new car registrations in the UK hit a local high with 2.69 new registrations in 2016, according to the Society of Motor Manufacturers and Traders (SMMT). Contributing factors could be an increase in households buying cars, or some households buying a second (or third) car. Second cars in particular could cause the average annual mileage per vehicle to decrease, as additional cars are used less frequently than primary household cars.
More Miles Traveled
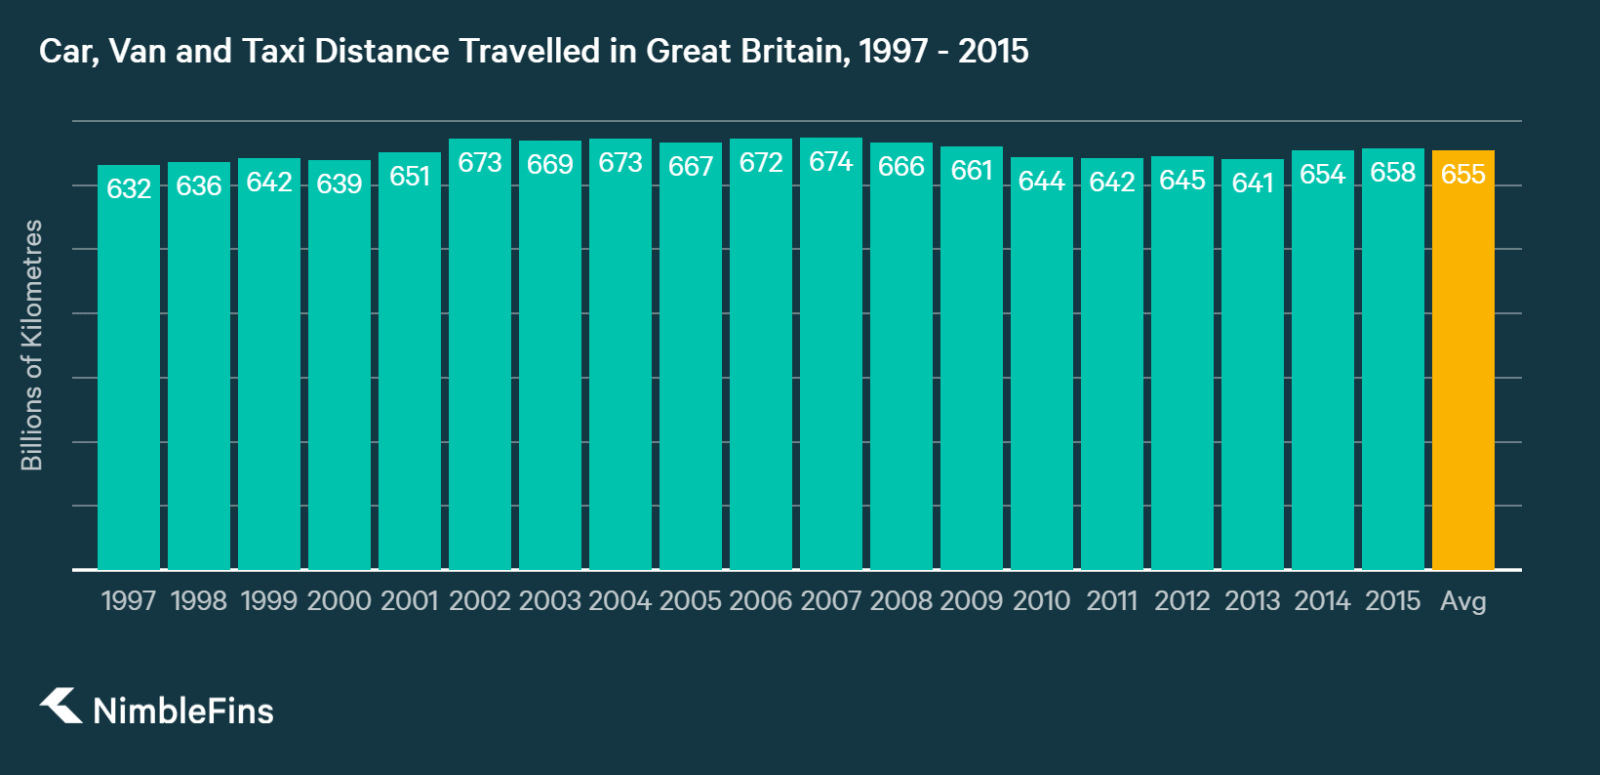
We found that British roads were used for 658 billion kilometres of car, van and taxi travel in 2015, according to data from the Department of Transport. While 2.3% less than the peak of 673 billion km in 2004, the number has nonetheless been rising in recent years from a local low of 641 billion km in 2013. So despite the average annual mileage of individual cars seeing a steady decline, more cars on the road has translated into a rise in total miles driven across Great Britain.
Mileage is correlated with the usable life of a vehicle. With individual cars accumulating fewer miles per year, consumers are able to keep their cars for longer. You can see how Brits are using their cars in the table below.
| Year | Business mileage | Commuting mileage | Other private mileage | Total mileage |
|---|---|---|---|---|
| 2002 | 1300 | 2700 | 5100 | 9200 |
| 2003 | 1200 | 2800 | 5100 | 9200 |
| 2004 | 1100 | 2800 | 5200 | 9100 |
| 2005 | 1100 | 2700 | 5100 | 8900 |
| 2006 | 1000 | 2800 | 4900 | 8700 |
| 2007 | 1100 | 2700 | 5000 | 8900 |
| 2008 | 1000 | 2700 | 4900 | 8600 |
| 2009 | 900 | 2600 | 4800 | 8300 |
| 2010 | 900 | 2700 | 4700 | 8300 |
| 2011 | 900 | 2600 | 4700 | 8100 |
| 2012 | 800 | 2500 | 4700 | 8100 |
| 2013 | 700 | 2800 | 4400 | 7900 |
| 2014 | 700 | 2800 | 4400 | 7900 |
| 2015 | 600 | 2900 | 4400 | 7900 |