Safest Places in the East Midlands
Erin Yurday, Founder - February 25, 2018The East Midlands is home to over 4.5 million people living in Derbyshire, Leicestershire, Northamptonshire, Nottinghamshire, Rutland and parts of Lincolnshire. With safety an ever-present concern, the ValuePenguin team analysed the most recent data from police.uk via UKCrimeStats to determine its safest places.
The 44 postal towns included in this regional study have populations of at least 1,000 and crime scores that ranged from 593 to 3,891 (where a lower score indicates less crime). The crime score considers both violent crime and property crime, adjusted for population size.
For more information on how we calculated the crime score, see our Methodology section below.
5 Safest Places in the East Midlands
The following five postal towns have an average crime score of 857, which is 60% lower than other towns in the region. With some of the lowest violent crime rates in particular, these are the safest places in the East Midlands.
1. Dronfield
With a population close to 25,000, the post town of Dronfield (which also includes the villages of Coal Aston and Dronfield Woodhouse) is the safest place in the East Midlands, sporting an overall crime score of 593. In fact, Dronfield, watched over by the Derbyshire Constabulary, has the lowest violent crime rate for a post town of its size (population 20,000 to 50,000) in all of England and Wales.
This middle-class area, with an average household income of £41,000, is located just 3 miles east of the Peak District National Park and home to Sheffield F.C., the world’s oldest football club. The most recent policing priorities involve ticketing vehicles parked in white zig zag lines near schools and carrying out speed checks near schools and problem areas.
2. Bakewell
Bakewell and the surrounding villages of Ashford-in-the-Water, Baslow, Chatsworth, Edensor, Hassop, Monyash and Youlgreave are home to under 10,000 people. A popular tourist destination and market town, the Bakewell post town has a crime score of 890. The Derbyshire Constabulary handles law enforcement for these communities.
The Peak District National Park Authority is a large employer in the area, where families earn average household incomes just under £40,000 a year. Local police are focused on tackling illegal off roading, boosting vehicle security in car parks across the Derbyshire Dales and improving the security of land, outbuildings and vehicles at local farms.
3. Southwell
Southwell is a close third in terms of safety, with a crime score of 898. Nottinghamshire Police handle policing in the area. Community outreach is a priority, with residents having access to officers at Safer Neighbourhood group meetings and beat surgeries. Average household incomes over £41,000 are quite a bit higher than the East Midland’s average of £35,700.
4. Belper
Belper, which includes surrounding villages of Ambergate , Duffield, Heage, Holbrook, Kilburn and Milford, is the largest post town in the top five, home to nearly 40,000 people. Despite the larger size, the area boasts an overall crime score of just 913. Average household incomes are just below £42,000 a year. Part of the Derbyshire Constabulary, local police priorities include the ShopWatch radio scheme to reduce retail crime and reducing street drinking and antisocial behaviour.
5. Hope Valley
The Hope Valley post town covers a rural area in the Peak District, including the following villages: Bamford, Bradwell, Brough, Calver, Castleton, Edale, Eyam, Grindleford, Hathersage, Hope and Stoney Middleton. Home to about 10,000 residents and falling within the Derbyshire Contabulary, Hope Valley’s crime score is 992. The area’s violent crime score is particularly low, second only to Dronfield in all of the East Midlands.
Police priorities include building relationships with schools to boost awareness of Safer Neighbourhood teams, Church Watch (to prevent theft from and vandalism of churches), improving security of property on local farms and boosting vehicle security across the Derbyshire Dales. Average household income in Hope Valley is nearly £43,000 a year, the highest among the safest 5 post towns in the East Midlands.
Population Breakdown
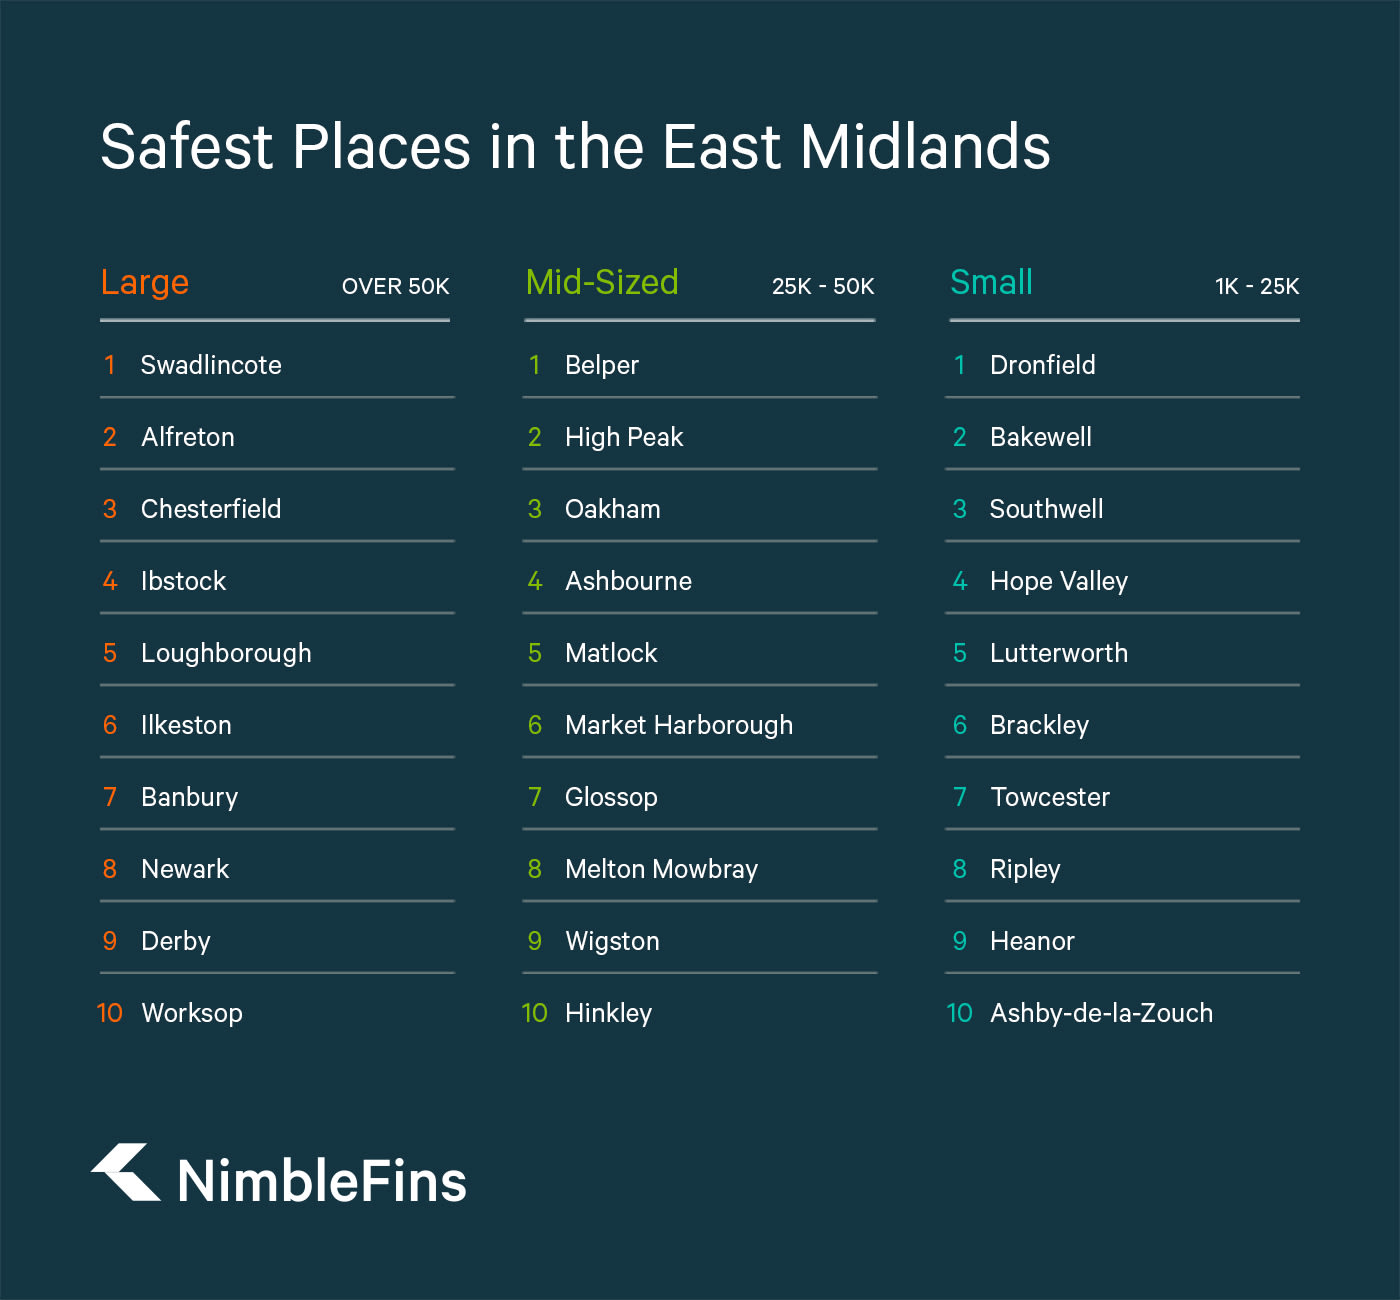
Despite the fact that we adjust our crime scores for populations, it can still be difficult to compare a small village to a larger city. You’ll notice that the largest post town in our top five safest places in the East Midlands has a population of only 40,000 people. To account for this, we separated the post towns into three categories by population size: small post towns with populations between 1,000 and 25,000, midsize post towns with populations between 25,000 and 50,000 and large post towns with populations over 50,000. Here are our findings:
Full List of Places in the East Midlands
Below is the entire list of post towns in the East Midlands that we included in our “Safest Places in East Midlands” study (we included all post towns with populations greater than 1,000). The towns are listed from the safest to the least safe, according to our analysis. The calculation for the crime scores can be found in the methodology section below.
| Rank | Post Town | Crime Score |
|---|---|---|
1 | DRONFIELD | 593 |
2 | BAKEWELL | 890 |
3 | SOUTHWELL | 898 |
4 | BELPER | 913 |
5 | HOPE VALLEY | 992 |
6 | HIGH PEAK | 1,029 |
7 | OAKHAM | 1,068 |
8 | ASHBOURNE | 1,099 |
9 | MATLOCK | 1,244 |
10 | LUTTERWORTH | 1,364 |
11 | BRACKLEY | 1,396 |
12 | MARKET HARBOROUGH | 1,463 |
13 | GLOSSOP | 1,480 |
14 | SWADLINCOTE | 1,523 |
15 | TOWCESTER | 1,556 |
16 | ALFRETON | 1,583 |
17 | CHESTERFIELD | 1,607 |
18 | MELTON MOWBRAY | 1,642 |
19 | WIGSTON | 1,735 |
20 | RIPLEY | 1,743 |
21 | IBSTOCK | 1,802 |
22 | HINCKLEY | 1,831 |
23 | BUXTON | 1,868 |
24 | HEANOR | 1,890 |
25 | ASHBY-DE-LA-ZOUCH | 2,000 |
26 | LOUGHBOROUGH | 2,055 |
27 | ILKESTON | 2,120 |
28 | BANBURY | 2,237 |
29 | NEWARK | 2,239 |
30 | RUSHDEN | 2,460 |
31 | DERBY | 2,553 |
32 | WORKSOP | 2,594 |
33 | NOTTINGHAM | 2,666 |
34 | LEICESTER | 2,671 |
35 | RETFORD | 2,711 |
36 | DAVENTRY | 2,760 |
37 | MANSFIELD | 2,931 |
38 | SUTTON-IN-ASHFIELD | 3,006 |
39 | KETTERING | 3,040 |
40 | WELLINGBOROUGH | 3,176 |
41 | PETERBOROUGH | 3,327 |
42 | NUNEATON | 3,368 |
43 | CORBY | 3,683 |
44 | NORTHAMPTON | 3,891 |
Methodology
To rank these post towns, we collected data from police.uk through the UKCrimeStats website, from March 2016 to March 2017, which covers England, Wales and Northern Ireland. We excluded post towns with fewer than 1,000 residents because areas with small populations are highly sensitive to crime fluctuations with fewer overall crimes committed. The raw data report included property crimes (burglary, vehicle crimes, criminal damage & arson, other theft and bike theft), and violent crimes (violent crimes, robbery and theft from person).
As the raw data was broken out by postcode district (e.g., DE56), we aggregated the data into post towns. For example, the post town of Derby includes postcode districts DE1, DE21, DE22, DE23, DE24, DE3, DE65, DE72, DE73 and DE74. We then standardized the data to reflect violent and property crimes per 100,000, to account for population. Next, we then calculated a “crime score” by weighting violent crime at 80% and property crime at 20%. Though property crime is more prevalent, we figured that violent crime is more concerning to town residents. Finally, we ranked the cities based on their crime scores.
Here is an alphabetical table of all East Midlands Post Towns along with their overall ranks, making it easier to compare different cities. See where your town lies!
| Rank | Post Town | Population | Violent Crime per 100k | Property Crime per 100k | Crime Score |
|---|---|---|---|---|---|
16 | ALFRETON | 51,182 | 1,250 | 2,913 | 1,583 |
8 | ASHBOURNE | 25,602 | 937 | 1,746 | 1,099 |
25 | ASHBY-DE-LA-ZOUCH | 14,162 | 1,836 | 2,655 | 2,000 |
2 | BAKEWELL | 8,764 | 707 | 1,620 | 890 |
28 | BANBURY | 81,931 | 2,027 | 3,078 | 2,237 |
4 | BELPER | 39,818 | 763 | 1,512 | 913 |
11 | BRACKLEY | 18,522 | 1,226 | 2,079 | 1,396 |
23 | BUXTON | 31,914 | 1,701 | 2,532 | 1,868 |
17 | CHESTERFIELD | 175,661 | 1,391 | 2,471 | 1,607 |
43 | CORBY | 59,492 | 3,658 | 3,782 | 3,683 |
36 | DAVENTRY | 37,441 | 2,601 | 3,395 | 2,760 |
31 | DERBY | 322,781 | 2,221 | 3,879 | 2,553 |
1 | DRONFIELD | 24,857 | 398 | 1,372 | 593 |
13 | GLOSSOP | 33,104 | 1,299 | 2,205 | 1,480 |
24 | HEANOR | 18,589 | 1,625 | 2,953 | 1,890 |
6 | HIGH PEAK | 29,401 | 738 | 2,194 | 1,029 |
22 | HINCKLEY | 47,511 | 1,480 | 3,237 | 1,831 |
5 | HOPE VALLEY | 10,789 | 612 | 2,512 | 992 |
21 | IBSTOCK | 58,824 | 1,455 | 3,191 | 1,802 |
27 | ILKESTON | 50,000 | 1,844 | 3,226 | 2,120 |
39 | KETTERING | 107,384 | 2,728 | 4,288 | 3,040 |
34 | LEICESTER | 577,122 | 2,269 | 4,281 | 2,671 |
26 | LOUGHBOROUGH | 122,226 | 1,626 | 3,768 | 2,055 |
10 | LUTTERWORTH | 20,773 | 934 | 3,086 | 1,364 |
37 | MANSFIELD | 142,274 | 2,778 | 3,543 | 2,931 |
12 | MARKET HARBOROUGH | 34,458 | 1,155 | 2,693 | 1,463 |
9 | MATLOCK | 33,465 | 1,115 | 1,760 | 1,244 |
18 | MELTON MOWBRAY | 44,360 | 1,398 | 2,617 | 1,642 |
29 | NEWARK | 88,359 | 2,002 | 3,188 | 2,239 |
44 | NORTHAMPTON | 282,022 | 3,549 | 5,259 | 3,891 |
33 | NOTTINGHAM | 743,152 | 2,459 | 3,494 | 2,666 |
42 | NUNEATON | 100,063 | 3,294 | 3,665 | 3,368 |
7 | OAKHAM | 32,513 | 913 | 1,689 | 1,068 |
41 | PETERBOROUGH | 248,482 | 3,002 | 4,627 | 3,327 |
35 | RETFORD | 35,943 | 2,510 | 3,517 | 2,711 |
20 | RIPLEY | 22,075 | 1,554 | 2,501 | 1,743 |
30 | RUSHDEN | 38,277 | 2,260 | 3,260 | 2,460 |
3 | SOUTHWELL | 8,993 | 790 | 1,334 | 898 |
38 | SUTTON-IN-ASHFIELD | 72,893 | 2,678 | 4,316 | 3,006 |
14 | SWADLINCOTE | 64,440 | 1,321 | 2,332 | 1,523 |
15 | TOWCESTER | 23,047 | 1,241 | 2,816 | 1,556 |
40 | WELLINGBOROUGH | 86,849 | 2,797 | 4,693 | 3,176 |
19 | WIGSTON | 32,873 | 1,530 | 2,555 | 1,735 |
32 | WORKSOP | 67,377 | 2,194 | 4,196 | 2,594 |
Comments