Safest Places in North West England
by - February 12, 2018North West England is home to over 7 million people living in the five counties of Cheshire, Cumbria, Greater Manchester, Lancashire and Merseyside. With safety being a top priority these days, ValuePenguin has analysed data from police.uk (via the UKCrimeStats website) in order to identify the safest places in North West England.
Ninety-six post towns with populations greater than 3,000 residents were included in the study. The analysis of both violent crime and property crime shows overall crime scores ranging from 640 to 5,473 (a lower score indicates less crime), adjusted for population size.
For more information on how the crime scores were calculated, please see the Methodology section below.
5 Safest Places in North West England
The safest five post towns in the North West have an average crime score of 796, which is 65% lower than other towns in the area. Not surprisingly, small towns dominated the top 5 spots.
1. Askam-in-Furness
With a population over 3,000 residents, LA16 in Cumbria is the safest post town in North West England, boasting an overall score of just 640. Remarkably, Askam and Ireleth's violent crime score of 448 is a whopping 78% lower than average across the North West. Households earn an average of £38,000 per year in this safe area. Local police have recently prioritized underage drinking to continue keeping the area safe.
2. Tarporley
The CW6 Tarporley post town sports an overall crime score of 712, an impressive 71% lower than the north west average crime score. Tarporley also comes in second in terms of violent crime score, so residents can sleep peacefully at night. Households in Tarporley earn more than any other post town in the top 5, averaging £45,000 per year.
3. Brampton
The Brampton post town, which includes Brampton, Gilsland, Greenhead and Slaggyford, is home to over 10,000 residents and ranks 3rd in the North West with an overall crime score of 864. Average household incomes in the CA8 post town are close to £33,000 per year. Local policing priorities in the summer of 2017 focused on keeping the young people engaged, for instance by working with the Brampton Community Centre and Summer Splash.
4. Grange-over-Sands
The Grange-over-Sands post town, which includes the small village of Allithwaite, ranks 4th in terms of safety in the north west with an overall crime score of 873. Of particular note, LA11 came in with the lowest property crime score in the north west. In Grange-over-Sands, households earn an average of £32,000 each year.
5. Seascale
With only a few thousand residents, the CA20 post town of Seascale rounds out the top 5 safest places in the north west. Included in the Seascale post town are Seascale, Sellafield, Gosforth and Wasdale Head. Average incomes in this relatively well-off area are close to £42,000 per year per household.
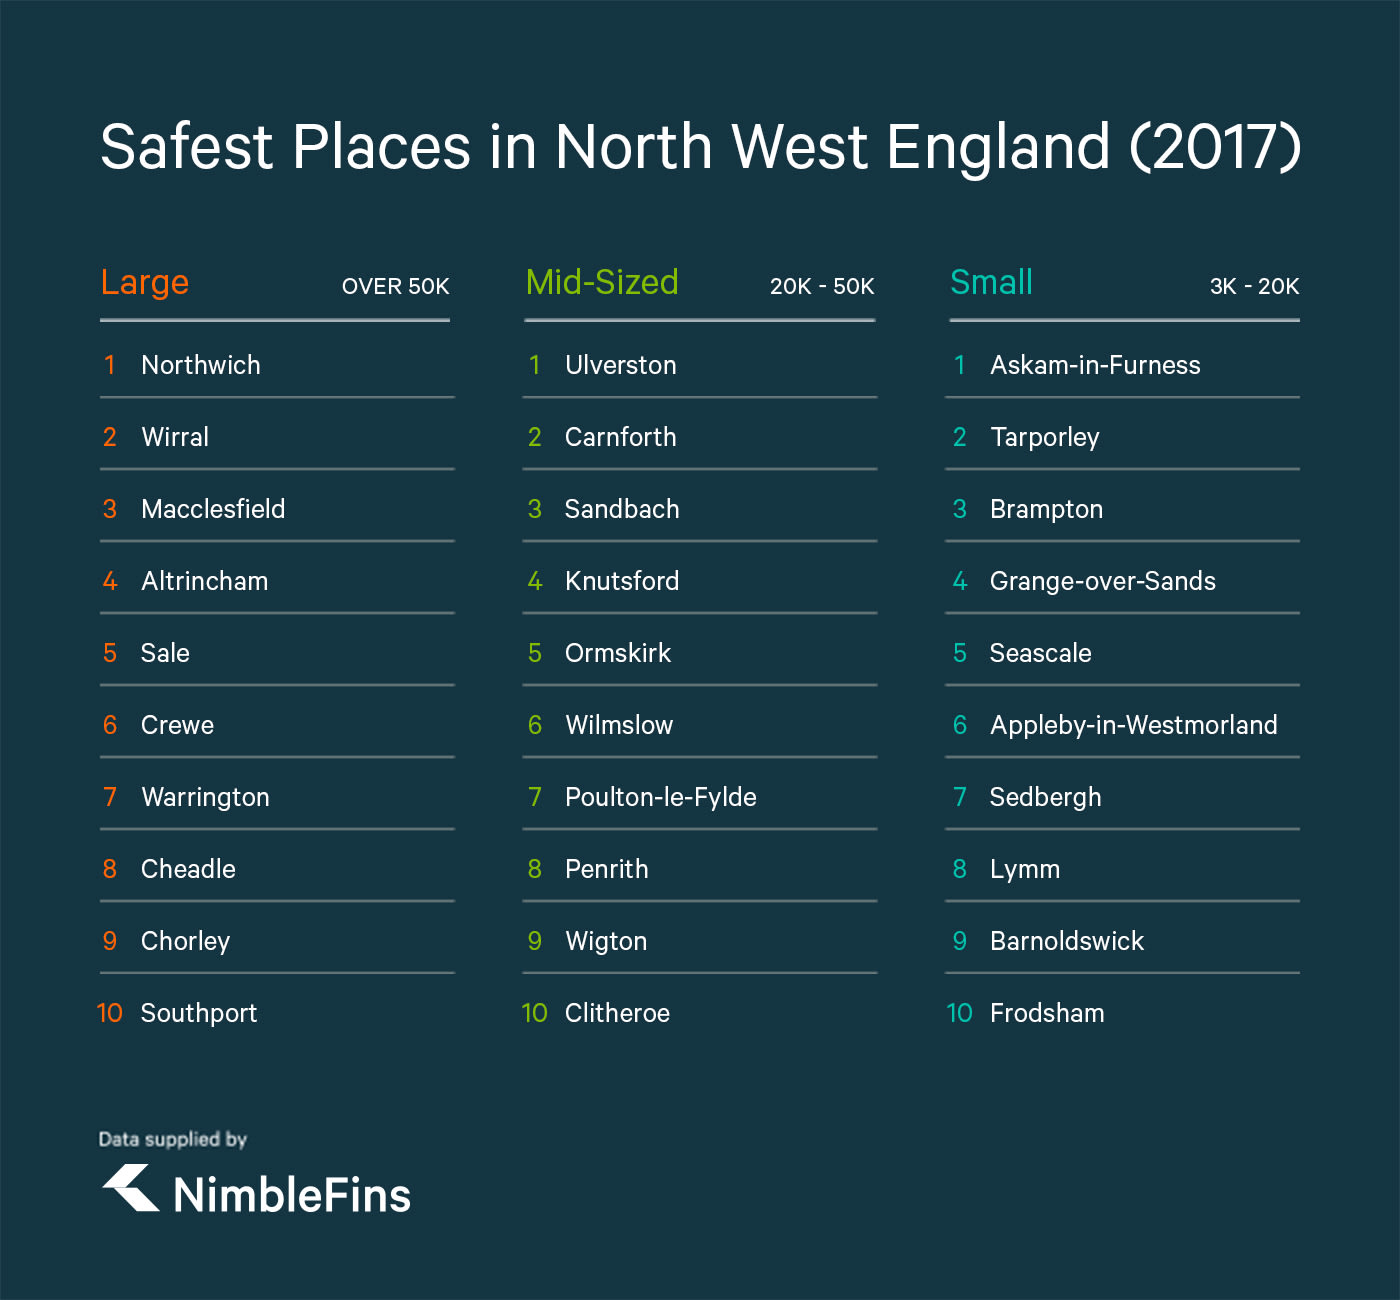
Population Breakdown
Even though we have adjusted the crime scores for population, it can be difficult to compare small villages to large cities. Perhaps not surprisingly, small post towns dominated our list of the Top 5 Safest Post Towns in North West England. In fact, the largest post town in the top 5 is home to only around 12,000 residents.
To account for this, we have also divided the post towns into three categories by population size: small post towns with between 3,000 and 20,000 residents, midsize post towns with between 20,000 and 50,000 residents and large post towns with over 50,000 residents. Here are our findings:
Full List of Places in North West England
In the following table you can see all 96 North West England post towns that were included in our "Safest Places in North West England" study of post towns with populations over 3,000. We've listed the towns here, from the most safe to the least safe according to our analysis. See below for more information on our methodology.
| Rank | Post Town | Crime Score |
|---|---|---|
| 1 | ASKAM-IN-FURNESS | 640 |
| 2 | TARPORLEY | 712 |
| 3 | BRAMPTON | 864 |
| 4 | GRANGE-OVER-SANDS | 873 |
| 5 | SEASCALE | 894 |
| 6 | ULVERSTON | 903 |
| 7 | APPLEBY-IN-WESTMORLAND | 950 |
| 8 | SEDBERGH | 977 |
| 9 | LYMM | 981 |
| 10 | BARNOLDSWICK | 1,046 |
| 11 | FRODSHAM | 1,063 |
| 12 | CARNFORTH | 1,068 |
| 13 | MALPAS | 1,081 |
| 14 | NESTON | 1,092 |
| 15 | KIRKBY STEPHEN | 1,123 |
| 16 | DALTON-IN-FURNESS | 1,132 |
| 17 | SANDBACH | 1,150 |
| 18 | MILNTHORPE | 1,170 |
| 19 | KNUTSFORD | 1,186 |
| 20 | ORMSKIRK | 1,197 |
| 21 | WILMSLOW | 1,256 |
| 22 | POULTON-LE-FYLDE | 1,270 |
| 23 | KESWICK | 1,299 |
| 24 | COCKERMOUTH | 1,312 |
| 25 | NORTHWICH | 1,377 |
| 26 | PENRITH | 1,403 |
| 27 | WIRRAL | 1,439 |
| 28 | WIGTON | 1,448 |
| 29 | CLITHEROE | 1,472 |
| 30 | NANTWICH | 1,485 |
| 31 | MILLOM | 1,535 |
| 32 | KENDAL | 1,543 |
| 33 | MIDDLEWICH | 1,596 |
| 34 | AMBLESIDE | 1,625 |
| 35 | THORNTON-CLEVELEYS | 1,630 |
| 36 | MACCLESFIELD | 1,682 |
| 37 | LYTHAM ST. ANNES | 1,708 |
| 38 | CONGLETON | 1,744 |
| 39 | PRENTON | 1,778 |
| 40 | ALTRINCHAM | 1,784 |
| 41 | EGREMONT | 1,814 |
| 42 | SALE | 1,904 |
| 43 | CREWE | 1,920 |
| 44 | WARRINGTON | 1,939 |
| 45 | ROSSENDALE | 1,945 |
| 46 | CHEADLE | 2,031 |
| 47 | LEYLAND | 2,050 |
| 48 | CHORLEY | 2,083 |
| 49 | CLEATOR MOOR | 2,085 |
| 50 | WINDERMERE | 2,094 |
| 51 | PRESCOT | 2,120 |
| 52 | LITTLEBOROUGH | 2,133 |
| 53 | SKELMERSDALE | 2,158 |
| 54 | SOUTHPORT | 2,187 |
| 55 | ELLESMERE PORT | 2,190 |
| 56 | RUNCORN | 2,206 |
| 57 | WINSFORD | 2,245 |
| 58 | LANCASTER | 2,311 |
| 59 | FRIZINGTON | 2,323 |
| 60 | WIDNES | 2,345 |
| 61 | COLNE | 2,365 |
| 62 | PRESTON | 2,436 |
| 63 | WHITEHAVEN | 2,523 |
| 64 | CARLISLE | 2,535 |
| 65 | NELSON | 2,595 |
| 66 | STOCKPORT | 2,603 |
| 67 | WIGAN | 2,658 |
| 68 | WALLASEY | 2,683 |
| 69 | DARWEN | 2,726 |
| 70 | NEWTON-LE-WILLOWS | 2,787 |
| 71 | MARYPORT | 2,818 |
| 72 | BACUP | 2,846 |
| 73 | BLACKBURN | 2,866 |
| 74 | WORKINGTON | 2,925 |
| 75 | BARROW-IN-FURNESS | 3,061 |
| 76 | ACCRINGTON | 3,106 |
| 77 | ST. HELENS | 3,122 |
| 78 | LIVERPOOL | 3,185 |
| 79 | MORECAMBE | 3,237 |
| 80 | STALYBRIDGE | 3,241 |
| 81 | BURY | 3,311 |
| 82 | HYDE | 3,320 |
| 83 | BOLTON | 3,393 |
| 84 | BURNLEY | 3,466 |
| 85 | DUKINFIELD | 3,510 |
| 86 | FLEETWOOD | 3,547 |
| 87 | BOOTLE | 3,711 |
| 88 | OLDHAM | 3,856 |
| 89 | LEIGH | 4,098 |
| 90 | ROCHDALE | 4,194 |
| 91 | MANCHESTER | 4,248 |
| 92 | HEYWOOD | 4,421 |
| 93 | ASHTON-UNDER-LYNE | 4,666 |
| 94 | BIRKENHEAD | 4,781 |
| 95 | SALFORD | 4,989 |
| 96 | BLACKPOOL | 5,473 |
Methodology
To rank the post towns, we collected data from police.uk via the UKCrimeStats website, from March 2016 to March 2017, covering England, Wales and Northern Ireland. We excluded post towns with fewer than 3,000 residents since areas with smaller populations are more sensitive to crime fluctuations. The raw data included both property crimes (burglary, vehicle crimes, criminal damage & arson, other theft and bike theft) and violent crimes (violent crimes, robbery and theft from person).
Since the raw data was broken out by postcode district (e.g., FY1), we aggregated the data into post towns. For example, the post town of Blackpool includes postcode districts FY1, FY2, FY3 and FY4. To account for different town sizes, we standardized the data to reflect property and violent crimes per 100,000 residents. Next, we calculated an overall “crime score” by weighting violent crime at 80% and property crime at 20%. While property crime is more common, we think violent crime is more alarming to residents. Finally, we ranked the cities based on their crime scores.
Here are the North West England Post Towns listed alphabetically, so you can find the crime scores for your town.
| Rank | Post Town | Population | Violent Crime per 100k | Property Crime per 100k | Crime Score |
|---|---|---|---|---|---|
| 76 | ACCRINGTON | 61,420 | 2,599 | 5,135 | 3,106 |
| 40 | ALTRINCHAM | 71,014 | 1,525 | 2,822 | 1,784 |
| 34 | AMBLESIDE | 5,022 | 1,294 | 2,947 | 1,625 |
| 7 | APPLEBY-IN-WESTMORLAND | 6,187 | 905 | 1,131 | 950 |
| 93 | ASHTON-UNDER-LYNE | 56,469 | 4,280 | 6,209 | 4,666 |
| 1 | ASKAM-IN-FURNESS | 3,345 | 448 | 1,405 | 640 |
| 72 | BACUP | 15,300 | 2,477 | 4,320 | 2,846 |
| 10 | BARNOLDSWICK | 17,063 | 820 | 1,946 | 1,046 |
| 75 | BARROW-IN-FURNESS | 57,320 | 3,083 | 2,975 | 3,061 |
| 94 | BIRKENHEAD | 49,964 | 4,675 | 5,206 | 4,781 |
| 73 | BLACKBURN | 141,248 | 2,598 | 3,938 | 2,866 |
| 96 | BLACKPOOL | 134,239 | 5,157 | 6,738 | 5,473 |
| 83 | BOLTON | 278,542 | 3,097 | 4,577 | 3,393 |
| 87 | BOOTLE | 51,512 | 3,477 | 4,646 | 3,711 |
| 3 | BRAMPTON | 10,213 | 813 | 1,067 | 864 |
| 84 | BURNLEY | 94,231 | 2,860 | 5,891 | 3,466 |
| 81 | BURY | 101,321 | 3,161 | 3,909 | 3,311 |
| 64 | CARLISLE | 103,040 | 2,374 | 3,178 | 2,535 |
| 12 | CARNFORTH | 29,263 | 953 | 1,528 | 1,068 |
| 46 | CHEADLE | 58,434 | 1,585 | 3,816 | 2,031 |
| 48 | CHORLEY | 90,314 | 1,850 | 3,014 | 2,083 |
| 49 | CLEATOR MOOR | 6,091 | 1,904 | 2,807 | 2,085 |
| 29 | CLITHEROE | 31,641 | 1,217 | 2,490 | 1,472 |
| 24 | COCKERMOUTH | 15,012 | 1,166 | 1,898 | 1,312 |
| 61 | COLNE | 23,032 | 1,945 | 4,047 | 2,365 |
| 38 | CONGLETON | 29,317 | 1,658 | 2,088 | 1,744 |
| 43 | CREWE | 101,576 | 1,844 | 2,224 | 1,920 |
| 16 | DALTON-IN-FURNESS | 7,913 | 973 | 1,769 | 1,132 |
| 69 | DARWEN | 34,179 | 2,273 | 4,535 | 2,726 |
| 85 | DUKINFIELD | 19,475 | 3,281 | 4,426 | 3,510 |
| 41 | EGREMONT | 9,284 | 1,659 | 2,434 | 1,814 |
| 55 | ELLESMERE PORT | 61,464 | 2,081 | 2,628 | 2,190 |
| 86 | FLEETWOOD | 25,939 | 3,277 | 4,626 | 3,547 |
| 59 | FRIZINGTON | 3,608 | 1,968 | 3,742 | 2,323 |
| 11 | FRODSHAM | 18,984 | 969 | 1,438 | 1,063 |
| 4 | GRANGE-OVER-SANDS | 9,827 | 895 | 784 | 873 |
| 92 | HEYWOOD | 27,886 | 3,988 | 6,154 | 4,421 |
| 82 | HYDE | 46,228 | 3,106 | 4,177 | 3,320 |
| 32 | KENDAL | 39,336 | 1,378 | 2,204 | 1,543 |
| 23 | KESWICK | 8,037 | 1,145 | 1,916 | 1,299 |
| 15 | KIRKBY STEPHEN | 4,827 | 1,036 | 1,471 | 1,123 |
| 19 | KNUTSFORD | 23,417 | 1,068 | 1,661 | 1,186 |
| 58 | LANCASTER | 74,568 | 2,030 | 3,436 | 2,311 |
| 89 | LEIGH | 47,823 | 3,607 | 6,062 | 4,098 |
| 47 | LEYLAND | 46,097 | 1,868 | 2,777 | 2,050 |
| 52 | LITTLEBOROUGH | 14,635 | 1,872 | 3,177 | 2,133 |
| 78 | LIVERPOOL | 715,832 | 2,918 | 4,251 | 3,185 |
| 9 | LYMM | 12,899 | 814 | 1,651 | 981 |
| 37 | LYTHAM ST. ANNES | 43,864 | 1,564 | 2,282 | 1,708 |
| 36 | MACCLESFIELD | 76,268 | 1,627 | 1,904 | 1,682 |
| 13 | MALPAS | 5,330 | 844 | 2,026 | 1,081 |
| 91 | MANCHESTER | 1,049,129 | 3,944 | 5,460 | 4,248 |
| 71 | MARYPORT | 16,110 | 2,638 | 3,538 | 2,818 |
| 33 | MIDDLEWICH | 14,790 | 1,467 | 2,110 | 1,596 |
| 31 | MILLOM | 9,995 | 1,561 | 1,431 | 1,535 |
| 18 | MILNTHORPE | 5,110 | 1,037 | 1,703 | 1,170 |
| 79 | MORECAMBE | 50,838 | 2,903 | 4,571 | 3,237 |
| 30 | NANTWICH | 29,327 | 1,453 | 1,613 | 1,485 |
| 65 | NELSON | 44,588 | 2,202 | 4,165 | 2,595 |
| 14 | NESTON | 19,027 | 930 | 1,740 | 1,092 |
| 70 | NEWTON-LE-WILLOWS | 22,189 | 2,497 | 3,948 | 2,787 |
| 25 | NORTHWICH | 68,418 | 1,339 | 1,529 | 1,377 |
| 88 | OLDHAM | 203,632 | 3,554 | 5,065 | 3,856 |
| 20 | ORMSKIRK | 46,188 | 1,033 | 1,853 | 1,197 |
| 26 | PENRITH | 36,063 | 1,273 | 1,924 | 1,403 |
| 22 | POULTON-LE-FYLDE | 27,751 | 1,200 | 1,549 | 1,270 |
| 39 | PRENTON | 38,582 | 1,558 | 2,657 | 1,778 |
| 51 | PRESCOT | 43,001 | 1,879 | 3,086 | 2,120 |
| 62 | PRESTON | 287,219 | 2,108 | 3,745 | 2,436 |
| 90 | ROCHDALE | 129,065 | 3,947 | 5,181 | 4,194 |
| 45 | ROSSENDALE | 41,140 | 1,694 | 2,946 | 1,945 |
| 56 | RUNCORN | 62,801 | 2,212 | 2,185 | 2,206 |
| 42 | SALE | 60,011 | 1,705 | 2,703 | 1,904 |
| 95 | SALFORD | 58,202 | 4,328 | 7,632 | 4,989 |
| 17 | SANDBACH | 22,321 | 1,057 | 1,519 | 1,150 |
| 5 | SEASCALE | 3,312 | 876 | 966 | 894 |
| 8 | SEDBERGH | 3,767 | 876 | 1,380 | 977 |
| 53 | SKELMERSDALE | 46,291 | 1,836 | 3,446 | 2,158 |
| 54 | SOUTHPORT | 96,736 | 2,020 | 2,857 | 2,187 |
| 77 | ST. HELENS | 127,934 | 2,886 | 4,067 | 3,122 |
| 80 | STALYBRIDGE | 27,625 | 3,030 | 4,083 | 3,241 |
| 66 | STOCKPORT | 243,080 | 2,235 | 4,075 | 2,603 |
| 2 | TARPORLEY | 12,300 | 585 | 1,220 | 712 |
| 35 | THORNTON-CLEVELEYS | 44,800 | 1,475 | 2,248 | 1,630 |
| 6 | ULVERSTON | 20,047 | 808 | 1,282 | 903 |
| 68 | WALLASEY | 60,805 | 2,452 | 3,605 | 2,683 |
| 44 | WARRINGTON | 215,359 | 1,797 | 2,509 | 1,939 |
| 63 | WHITEHAVEN | 28,849 | 2,465 | 2,759 | 2,523 |
| 60 | WIDNES | 61,866 | 2,211 | 2,882 | 2,345 |
| 67 | WIGAN | 215,035 | 2,347 | 3,905 | 2,658 |
| 28 | WIGTON | 23,057 | 1,331 | 1,913 | 1,448 |
| 21 | WILMSLOW | 37,926 | 1,073 | 1,985 | 1,256 |
| 50 | WINDERMERE | 9,092 | 1,815 | 3,212 | 2,094 |
| 57 | WINSFORD | 31,436 | 2,239 | 2,265 | 2,245 |
| 27 | WIRRAL | 170,220 | 1,282 | 2,066 | 1,439 |
| 74 | WORKINGTON | 35,832 | 2,757 | 3,597 | 2,925 |
Comments