How Dangerous is Driving a Mile in the South East? Areas of Highest and Lowest Risk Revealed
Erin Yurday, Founder - February 27, 2018From cobbled village streets to modern motorways, more than 22,000 miles of roads weave across South East England, but not all roads are equally safe. Driving a mile in some areas is more dangerous than in other areas. Where is a motorist most likely to have an accident, especially one involving death or serious injury?
In order to explore the safety of South East England roads, we gathered accident, casualty and traffic data from the Department for Transport (DfT) for each local authority to determine accident and casualty rates per mile of driving. (See the Methodology section below for a detailed description of how we generated our results.) This gives an indication of the level of risk for every mile you drive down a road in each local authority.
Which Areas have the Best and Worst Motor Vehicle Accident Rates in South East England?
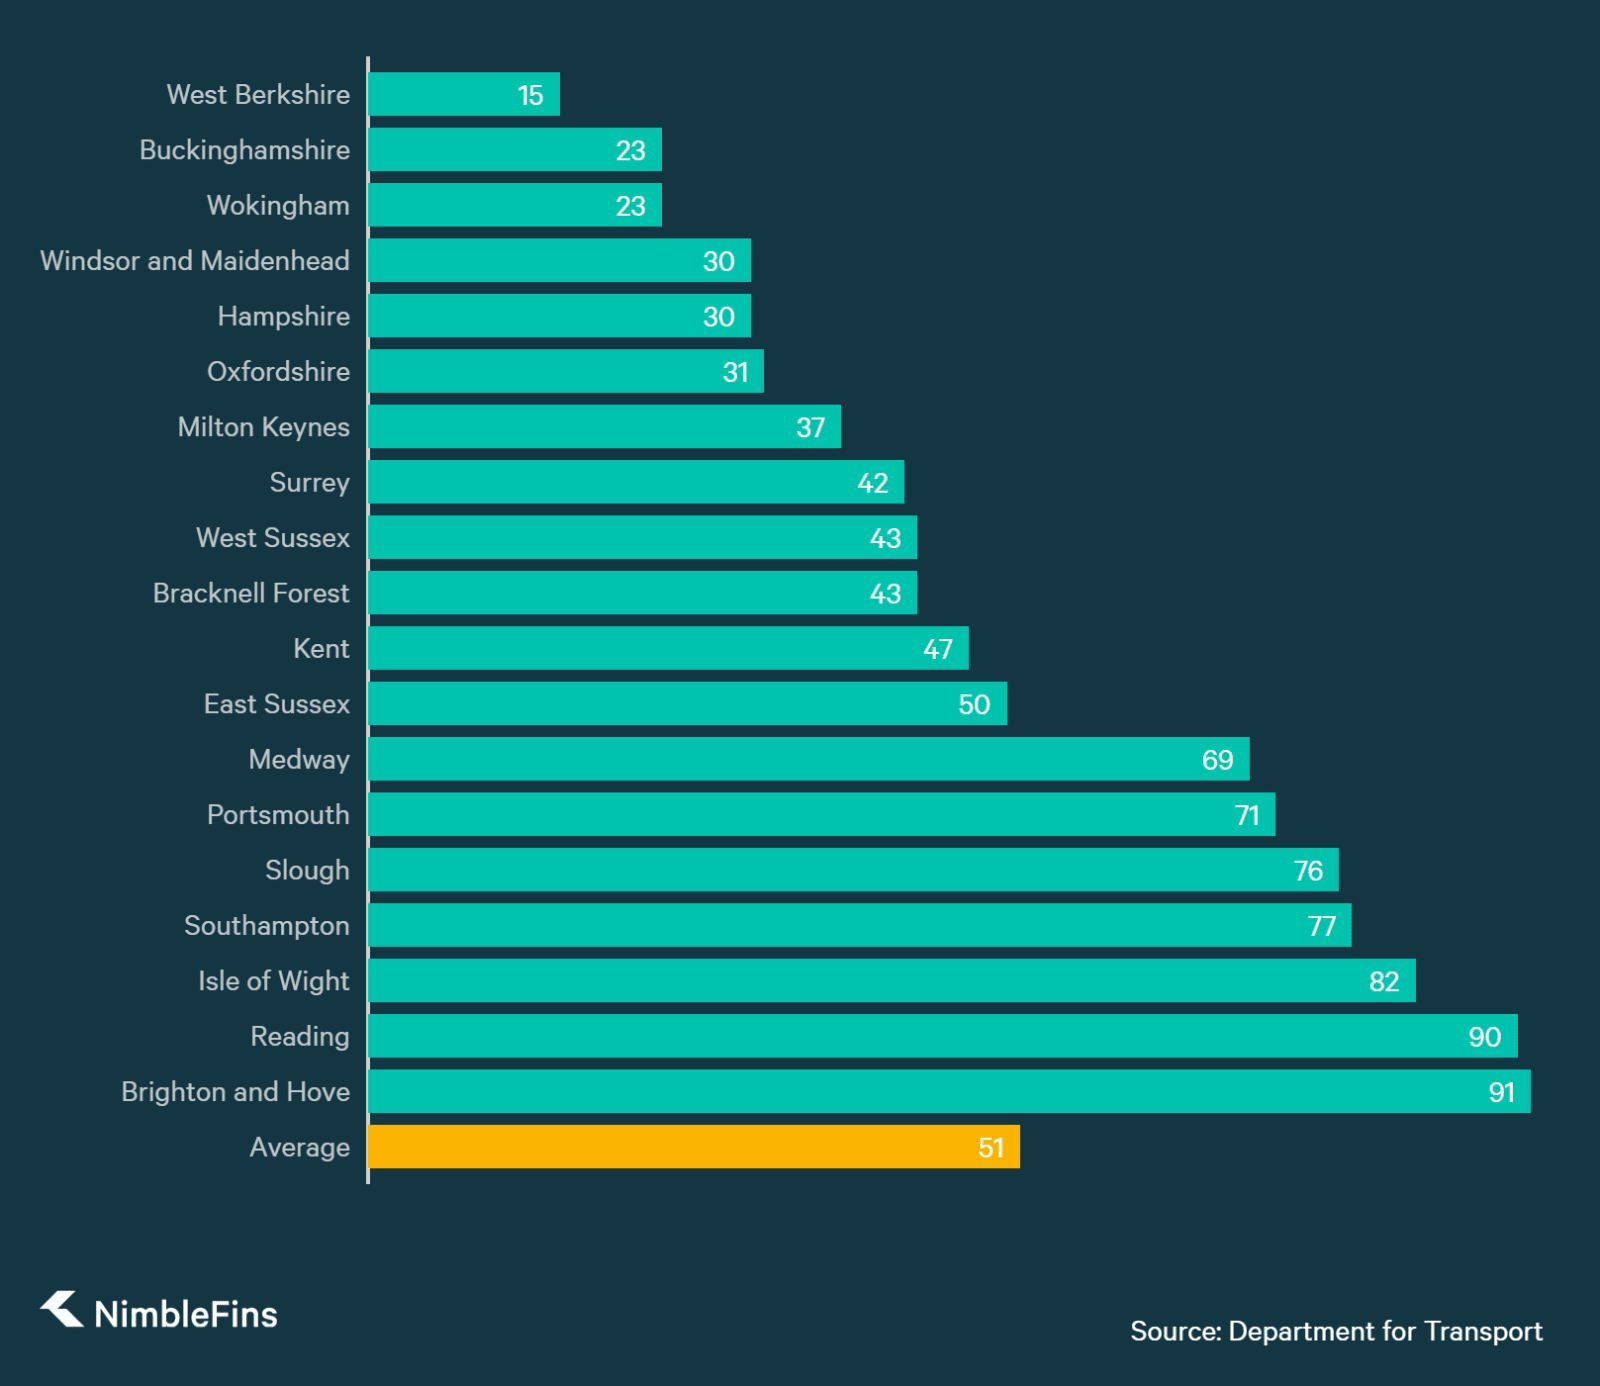
Motorists are least likely to have an accident driving through West Berkshire, with only 15 reported accidents per 100 million miles driven in 2016. Buckinghamshire and Wokingham are not far behind with 23 accidents per 100 million miles driven.
At the other end of the spectrum, drivers in Reading and Brighton & Hove face much higher accident rates of 90+ per 100 million miles of driving.
The data shows that you’re 6 times more likely to be in a motor vehicle accident driving a mile in Reading or Brighton & Hove than in West Berkshire.
Motor Vehicle Accident Rates by South East Local Authority
Number of accidents per 100 million miles driven on area roads
Local Authorities in the South East Ranked by Lowest to Highest Rate of Motor Vehicle Accidents
| Rank (1 is best, 19 is worst) | Local Authority | Vehicle Miles (million, per year) | Accidents (per year) | Accidents/100 Million Miles of Driving |
|---|---|---|---|---|
| 1 | West Berkshire | 1,935 | 298 | 15 |
| 2 | Buckinghamshire | 4,185 | 966 | 23 |
| 3 | Wokingham | 1,063 | 246 | 23 |
| 4 | Windsor and Maidenhead | 1,171 | 352 | 30 |
| 5 | Hampshire | 9,787 | 2,954 | 30 |
| 6 | Oxfordshire | 4,827 | 1,498 | 31 |
| 7 | Milton Keynes | 1,611 | 601 | 37 |
| 8 | Surrey | 8,897 | 3,742 | 42 |
| 9 | West Sussex | 4,631 | 1,988 | 43 |
| 10 | Bracknell Forest | 442 | 190 | 43 |
| 11 | Kent | 9,455 | 4,428 | 47 |
| 12 | East Sussex | 2,740 | 1,376 | 50 |
| 13 | Medway | 901 | 619 | 69 |
| 14 | Portsmouth | 795 | 561 | 71 |
| 15 | Slough | 549 | 416 | 76 |
| 16 | Southampton | 690 | 532 | 77 |
| 17 | Isle of Wight | 401 | 329 | 82 |
| 18 | Reading | 336 | 304 | 90 |
| 19 | Brighton and Hove | 859 | 779 | 91 |
| Average | 51 |
While all car accidents are undesirable, those resulting in death or severe injury are certainly of most concern. To see which areas are most and least risky in terms of life-changing accidents, we also analysed data on accidents in which someone was killed or seriously injured (either in the car or as a pedestrian).
While it was expected that the larger cities have a higher accident rate in general due to congestion, larger towns also showed a higher rate of accidents that resulted in death or severe injury.
Odds of Death or Severe Injury Whilst Driving a Mile
West Berkshire again tops the safety charts, joined by Wokingham, with 4 killed or seriously injured per 100 million miles of driving in each local authority. Windsor & Maidenhead and Buckinghamshire follow close behind, each with 5 killed or seriously injured per 100 million miles of driving.
Southampton, Isle of Wight and Brighton & Hove are the least safe, with 18, 19 and 20 killed or seriously injured per 100 million miles driven on their roads, respectively.
Motorists are at least 4.5X more likely to be killed or seriously injured for every mile they drive in any of these three areas than in West Berkshire or Wokingham.
Risk of Death or Severe Injury for Every Mile You Drive

Local Authorities in the South East Ranked by Lowest to Highest Rate of Killed or Seriously Injured in Motor Vehicle Accidents
| Rank (1 is best, 19 is worst) | Local/Unitary Authority | Vehicle Miles (million, per year) | Killed or Seriously Injured (per year) | Killed or Seriously Injured/100 Million Miles of Driving |
|---|---|---|---|---|
| 1 | West Berkshire | 1,935 | 72 | 4 |
| 2 | Wokingham | 1,063 | 46 | 4 |
| 3 | Windsor and Maidenhead | 1,171 | 55 | 5 |
| 4 | Buckinghamshire | 4,185 | 229 | 5 |
| 5 | Surrey | 8,897 | 553 | 6 |
| 6 | Milton Keynes | 1,611 | 107 | 7 |
| 7 | Oxfordshire | 4,827 | 357 | 7 |
| 8 | Hampshire | 9,787 | 757 | 8 |
| 9 | Slough | 549 | 51 | 9 |
| 10 | Kent | 9,455 | 887 | 9 |
| 11 | Bracknell Forest | 442 | 42 | 10 |
| 12 | Medway | 901 | 92 | 10 |
| 13 | West Sussex | 4,631 | 483 | 10 |
| 14 | East Sussex | 2,740 | 382 | 14 |
| 15 | Portsmouth | 795 | 111 | 14 |
| 16 | Reading | 336 | 47 | 14 |
| 17 | Southampton | 690 | 121 | 18 |
| 18 | Isle of Wight | 401 | 78 | 19 |
| 19 | Brighton and Hove | 859 | 169 | 20 |
| Average | 10 |
Methodology
To measure the dangerousness of roads in each local authority, we looked at the most recent 2016 data on motor vehicle miles (the number of miles driven in each borough), accidents and reported casualties (specifically, the number killed or seriously injured) from the Department for Transport. Dividing the number of accidents or casualties by the vehicle miles driven in each borough gives a measure of risk for each mile that is driven in a borough—e.g., the odds of an accident per mile that a driver spends on a road.
Comments