Living in London: How Much Do Households Actually Spend?
Each week, the average London household shells out £658 to live—£106 more than the UK average. In fact, Londoners spend 19% more running their households than the rest of the UK. We've delved into the data behind the latest Family Spending report from the Office of National Statistics (ONS) to learn how Londoners spend their budgets, and how this compares to the rest of the UK.
- Average Household Budget in London, per Week
- Average Household Budget in London, per Year
- How do London Budgets Compare to the UK?
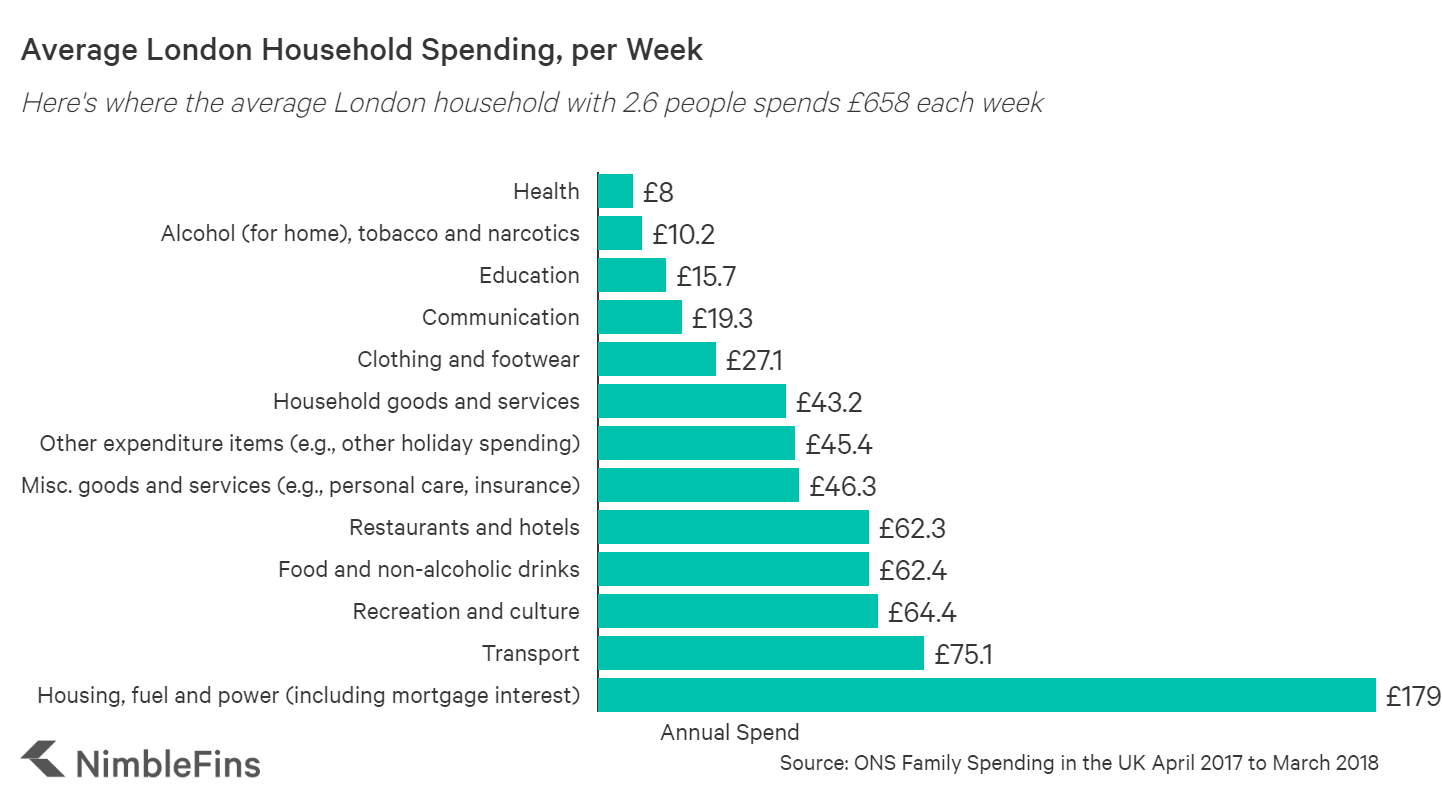
How Much do Londoners Spend Each Week on Living Expenses?
In the year ending March 2018, London households spent £658 each week on average for housing, transportation, food, and all the other expenses of life. As you can see in the table below, housing is the biggest budget item at £179 per week (either rent or mortgage interest payments), followed by transport, recreation and culture and food. £48 is spent weekly on restaurants (including takeaways, snack food, etc.) and £16.70 on alcohol (£7.40 on alcohol at home and £9.30 on alcohol away from home).
| Average Weekly Living Expenses in London per household | ||
|---|---|---|
| Housing, fuel and power (including mortgage interest) | £179 | |
| Net Rent | £80.3 | |
| Mortgage interest payments, council tax, etc. | £54.8 | |
| Water, gas, electricity, etc. | £34.6 | |
| Maintenance & Repairs | £9.2 | |
| Transport | £75.1 | |
| Purchase of Vehicles | £19.5 | |
| Operating personal transport (e.g., petrol, repairs, etc.) | £23 | |
| Rail, tube, bus, coach, fares | £15.6 | |
| Other (air fares, car leasing, etc.) | £17 | |
| Recreation and culture | £64.4 | |
| Package holidays* | £22 | |
| Sports admissions, leisure class fees, etc. | £10.7 | |
| TV, cable subscriptions, etc. | £6.3 | |
| Food and non-alcoholic drinks | £62.4 | |
| Restaurants and hotels | £62.3 | |
| Restaurants, takeaways, etc. | £48 | |
| Hotels | £14.30 | |
| Miscellaneous goods and services | £46.3 | |
| Personal Care (e.g., hairdressing, toiletries, etc.) | £13.5 | |
| Insurance | £18 | |
| Other expenditure items | £45.4 | |
| Other holiday spending | £25.4 | |
| Household goods and services | £43.2 | |
| Clothing and footwear | £27.1 | |
| Communication | £19.3 | |
| Education | £15.7 | |
| Alcoholic drink (at home), tobacco and narcotics | £10.2 | |
| Health | £8.0 | |
| Total | £658.3 | |
These numbers reflect the average London household of 2.6 people, according to the ONS. Given that housing is the biggest expense for Londoners, you may want to consider moving to a more affordable area of London.
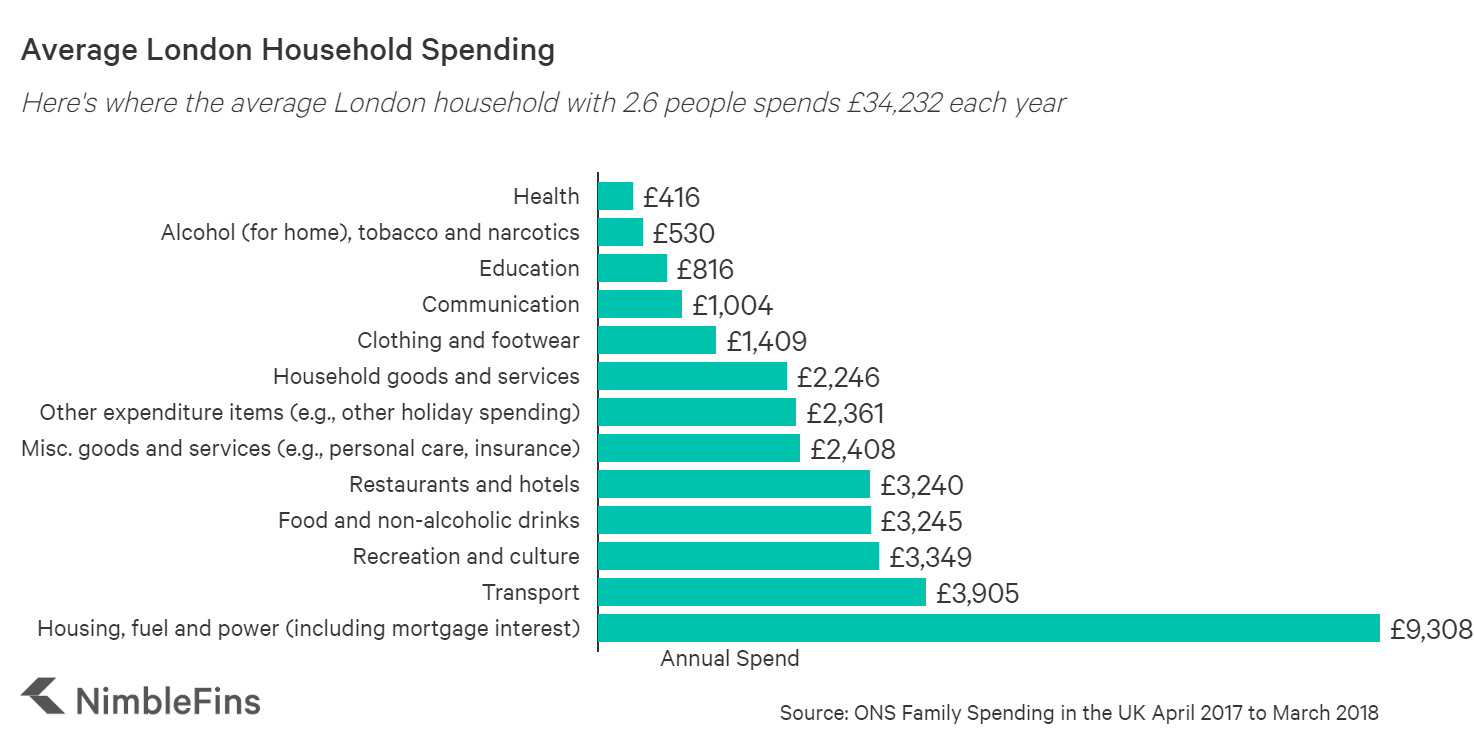
How Much do Londoners Spend Each Year on Living Expenses?
On an annual basis, those in London spend over £34,000 per year. Of that, £9,300 goes towards housing, fuel and power costs—nearly as much as transportation and food & drink combined. Londoners spend nearly as much on personal care (e.g., hairdressing and toiletries) as they do on public transport (that is, tube, rail, bus and coach fares)—£702 and £811 per year, respectively.
| Average Annual Living Expenses in London per household | ||
|---|---|---|
| Housing, fuel and power (including mortgage interest) | £9,308 | |
| Net Rent | £4,176 | |
| Mortgage interest payments, council tax, etc. | £2,850 | |
| *Water, gas, electricity, etc. | £1,799 | |
| Maintenance & Repairs | £478 | |
| Transport | £3,905 | |
| Purchase of Vehicles | £1,014 | |
| Operating personal transport (e.g., petrol, repairs, etc.) | £1,196 | |
| Rail, tube, bus, coach, fares | £811 | |
| Other (air fares, car leasing, etc.) | £884 | |
| Recreation and culture | £3,349 | |
| Package holidays | £1,144 | |
| Sports admissions, leisure class fees, etc. | £556 | |
| TV, cable subscriptions, etc. | £328 | |
| Food and non-alcoholic drinks | £3,245 | |
| Restaurants and hotels | £3,240 | |
| Restaurants, takeaways, etc. | £2,496 | |
| Hotels | £744 | |
| Miscellaneous goods and services | £2,408 | |
| Personal Care (e.g., hairdressing, toiletries, etc.) | £702 | |
| Insurance | £936 | |
| Other expenditure items | £2,361 | |
| Other holiday spending | £1,321 | |
| Household goods and services | £2,246 | |
| Clothing and footwear | £1,409 | |
| Communication | £1,004 | |
| Education | £816 | |
| Alcoholic drink, tobacco and narcotics | £530 | |
| Health | £416 | |
| Total | £34,232 | |
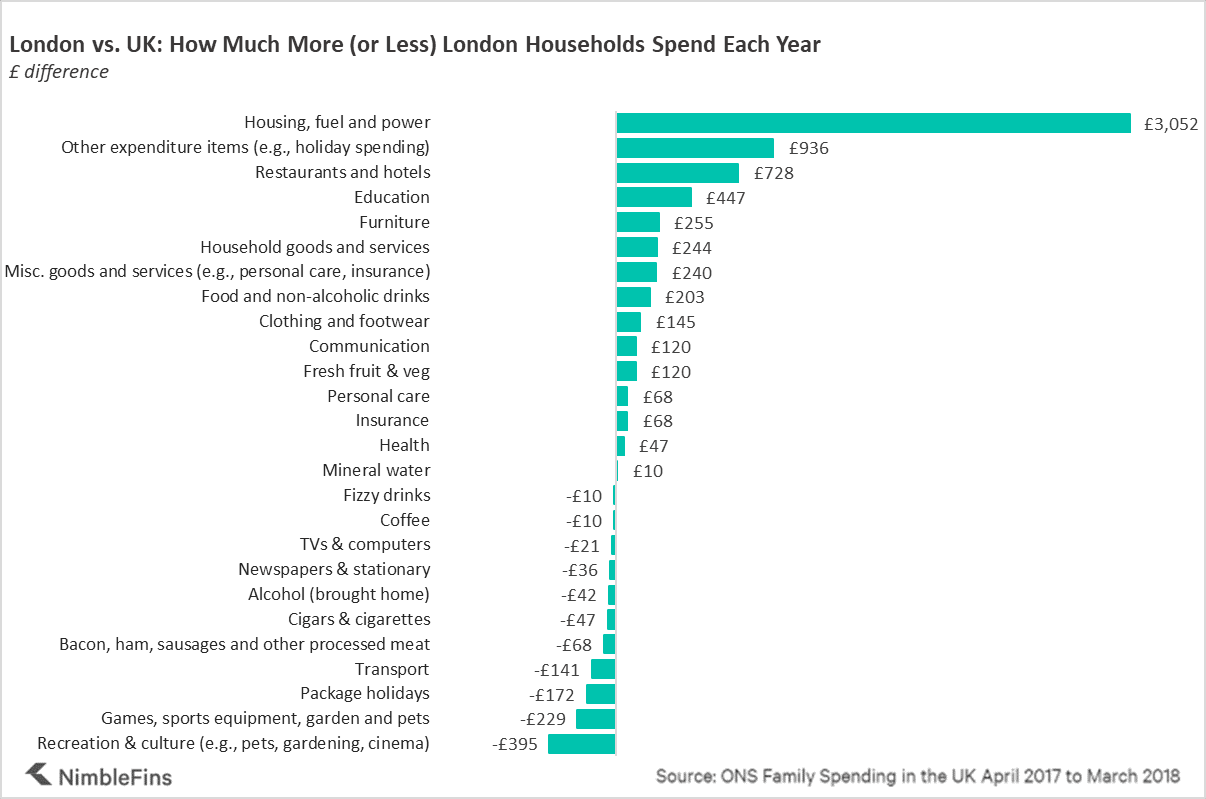
Household Budget Comparison: London vs. UK
Households in London spend 19% more than typical UK households on average, which amount to over £5,500 each year—no wonder the average Londoners carries £11,700 of personal debt, more than any other region. Not surprisingly, the budget category that stands out the most is housing (including fuel and power), where Londoners spend 49% or £3,000 more than UK averages. Londoners also spend more on restaurants and hotels, personal care, insurance, clothing, education, communication, holiday spending, health care and household goods and services.
There are a few budget categories where Londoners spend less than typical UK households: transport, recreation & culture and alcohol & tobacco.
Digging down into the budget subcategories we found some interesting differences between spending in London vs the UK as a whole. For example, Londoners spend around 38% less on pets, 11% less on tvs and computers, 13% less on package holidays and 13% less on newspapers and stationary than the rest of the UK. In terms of vices, Londoners spend 10% less on alcohol for home consumption and 24% less on cigarettes and cigars.
| London vs. UK: How Much More (or Less) do Londoners Spend per Year? | UK | London | Difference (£) | Difference (%) |
|---|---|---|---|---|
| Games, sports equipment, garden and pets | £676 | £447 | -£229 | -34% |
| Cigars & cigarettes | £192 | £146 | -£47 | -24% |
| Coffee | £47 | £36 | -£10 | -22% |
| Bacon, ham, sausages and other processed meat | £369 | £302 | -£68 | -18% |
| Package holidays | £1,316 | £1,144 | -£172 | -13% |
| Newspapers & stationary | £281 | £244 | -£36 | -13% |
| TVs & computers | £192 | £172 | -£21 | -11% |
| Recreation & culture (e.g., pets, gardening, cinema) | £3,744 | £3,349 | -£395 | -11% |
| Fizzy drinks | £99 | £88 | -£10 | -11% |
| Alcohol (brought home) | £426 | £385 | -£42 | -10% |
| Transport | £4,046 | £3,905 | -£141 | -3% |
| Food and non-alcoholic drinks | £3,042 | £3,245 | £203 | 7% |
| Insurance | £868 | £936 | £68 | 8% |
| Personal care | £634 | £702 | £68 | 11% |
| Misc. goods and services (e.g., personal care, insurance) | £2,168 | £2,408 | £240 | 11% |
| Clothing and footwear | £1,264 | £1,409 | £145 | 11% |
| Household goods and services | £2,002 | £2,246 | £244 | 12% |
| Health | £369 | £416 | £47 | 13% |
| Communication | £884 | £1,004 | £120 | 14% |
| Furniture | £946 | £1,201 | £255 | 27% |
| Fresh fruit & veg | £416 | £536 | £120 | 29% |
| Restaurants and hotels | £2,512 | £3,240 | £728 | 29% |
| Housing, fuel and power | £6,256 | £9,308 | £3,052 | 49% |
| Mineral water | £21 | £31 | £10 | 50% |
| Other expenditure items (e.g., holiday spending) | £1,425 | £2,361 | £936 | 66% |
| Education | £369 | £816 | £447 | 121% |

Source: