Divorce Statistics UK 2026
This data is currently the latest available as of January 2026.
Over the past 50 years, one third of marriages have ended in divorce. We've analysed Office for National statistics data to find out how divorce rates have changed over the past 20 years and how they vary by age group. Read on to find out the average age of men and women when they get divorced, and the worst years to have gotten married according to divorce stats. To read about how much a divorce will cost, see our article on the average cost of a divorce.
- What proportion of marriages end in divorce?
- Worst marriage years for divorces?
- How many divorces are there each year?
- Household wealth stats after divorce
Online divorce help for £199
Find out more
- Rated 'Excellent' 4.6/5 on Trustpilot
- Over 150,000 couples helped in past 20+ years
- Get started with only one form
- This company handles ~5% of all UK divorces
Divorce Rate
The average overall divorce rate in England and Wales is 33.9%, based on all marriages over the past 60 years between 1963 to 2023. However, the rate changes according to how many years a couple has been together, and even the year they married.
For example, of couples who married 50 years ago in 1973, 35.2% had ended in divorce by 2023. In contrast, 43.0% of those marrying in 1973 had divorced by 2023. And 17.5% of couples married in 2013 had divorced within the first ten years by 2023. (This is down from 20% a few years ago, indicating that younger couples seem to be more likely to stay together now.)
| Cumulative Divorce Rates | |
|---|---|
| 50 years since marriage | 35.2% |
| 40 years since marriage | 43.0% |
| 30 years since marriage | 43.9% |
| 20 years since marriage | 35.8% |
| 10 years since marriage | 17.5% |
| Percentage since marriages since 1963 that have ended in divorce | 33.9% |
Worst Marriage Years for Divorces?
Interestingly, some marriage years have worse divorce stats than other years. For example, 1987 has the highest cumulative divorce rate—of couples married in 1987, 45% have since ended in divorce.

So, couples who tied the knot in 1987 have the highest cumulative divorce rate SO FAR, with 45% of these marriages ending in divorce by 2023.
However it's not a surprise that the cumulative divorce rate is lower for more recent marriage years (since 1987), as they've had fewer years of accumulated divorces. Since the cumulative rate so far has peaked for those married in 1987, it's safe to say that the worst year to get married was 1987—if you married before 1988.
Could more recent marriages be on track to be worse than 1987?
Another way to measure the worst years for marriages is charting the data for each marriage year, showing each marriage year's cumulative divorce rate over time. That would be a lot of lines on a chart to look at (one line per marriage year) so for easier viewing we grouped marriage years into 5-year buckets for a cohort analysis (e.g. married between 1986 and 1990, etc.).
As you can see in the chart below, the cohort including 1987 (the suspected worst marriage year so far) is in fact a higher divorce rate bucket (1986-1990, the red line in the chart below), but it looks like 1991-1995 (orange line) is on track to be even worse with higher cumulative divorce rates—just give it a few more years...
More recent cohort, such as 2011-2015 and 2016-2020, are tracking better with much lower divorce rates so far at each wedding anniversary. For example, those married in 1992 were more than twice as likely to divorce by their 5th wedding anniversary as those married in 2014.
The most recent years are looking even better, with divorce rates continuing to drop among the newlywed.

Changing Divorce Rates
The most recent data as of January 2026 indicates that the divorce rate has changed dramatically over the years—especially for longer marriages. The chart below shows how divorce rates for those married 10, 20 and 30 years has changed over the past 25 years. As you can see, there's been an improvement in the proportion of marriages failing by 10 years (most recently down to a 17.5% divorce rate), but interestingly there's a much higher proportion of marriages failing by 30 years (30.6% in 1998 vs. 43.9% in 2022)—probably this reflects a changing society, with views on divorce changing.

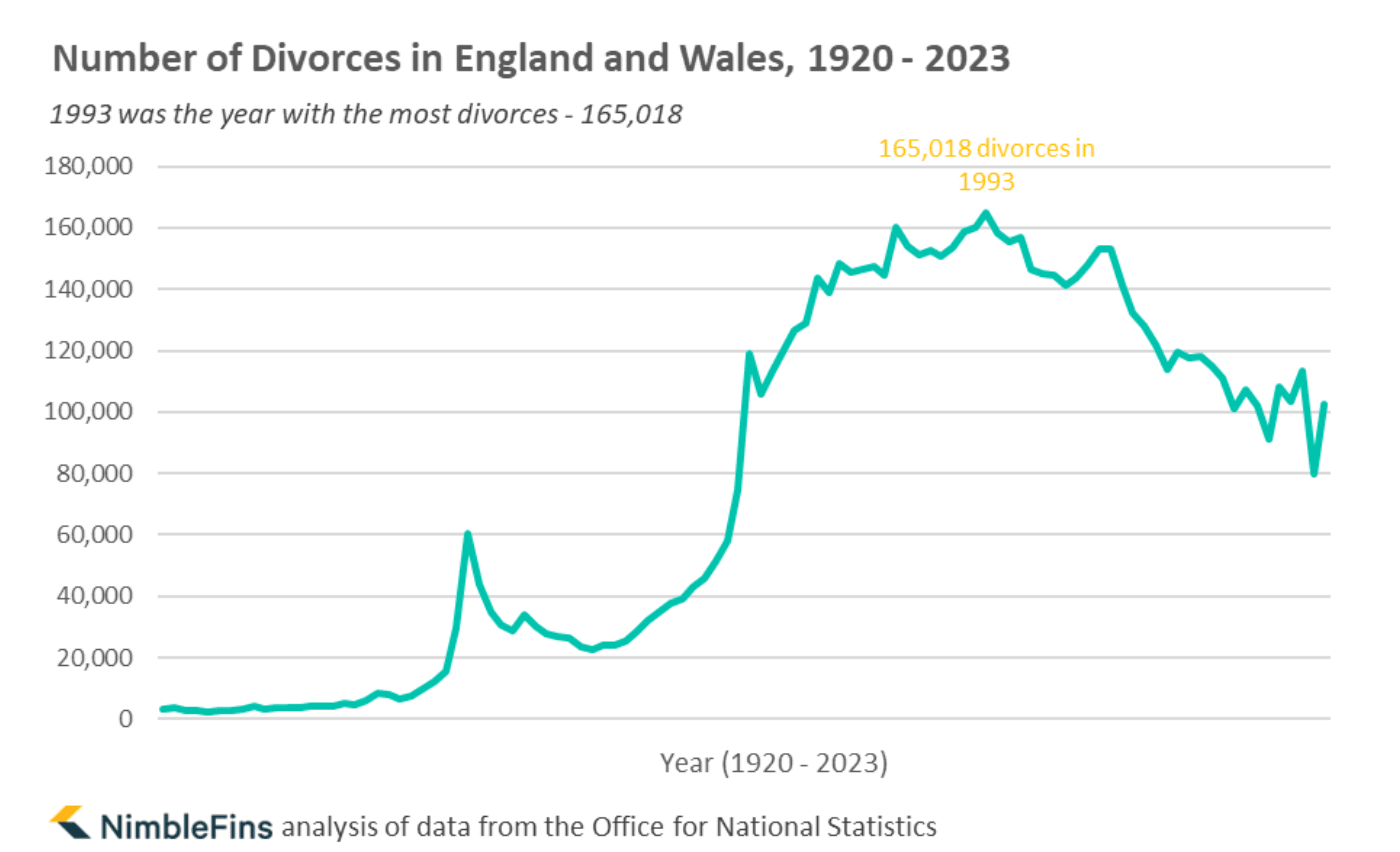
Number of Divorces
The most recent data as of January 2026 indicated that there were 102,678 divorces in England and Wales (in 2023)—100,787 were opposite-sex divorces and 1,891 were of same-sex couples. This is a decrease of 37.8% since 1993, the year with the largest number of divorces, when a whopping 165,018 marriages ended by divorce.
| Stats on Number of Divorces | |
|---|---|
| Year with the most divorces | 1993 (165,018 divorces) |
| Year of marriage with the worst divorce rate | 1987 (45% had divorced by 2022) |
| Number of divorces 2023 | 102,678 (100,787 opposite sex, 1,891 same sex) |
| Percentage drop in annual divorces from 1998 to 2023. (25 years) | 29.3% |
Note: the figure for 2022 could be abnormally low because the Divorce, Dissolution and Separation Act 2020 introduced a minimum period of 20 weeks between the start of proceedings and application for final order. The ONS says this may have had an impact on the number and timing of divorces taking place from April 2022.
However, that's not the whole story. While the number of divorces has been steadily dropping, so has the number of couples getting married. So fewer divorces doesn't necessarily mean that couples are getting better at staying together. The year with the highest number of marriages was 1972, when 426,241 couples said, "I do." By 2023, that number had dropped to 224,402—a decrease of 47%. (2020 was even lower, at just 85,770 marriages, but we view that as a data blip due to the pandemic.)

Household Wealth After Divorce
Of course, when one household splits into two households after a divorce and assets have been divided somehow, the two new divorced households each have less wealth than the combined married household did. No surprise then that divorced households are more likely to have less money, and less likely to have more money. But what do the stats really look like?
We dug into data from the most recent Wealth and Assets Survey (ONS) that is available in January 2026 to find out. On the lower side of wealth, we found that only 13% of married households have less than £85,000 of total household wealth, but 36.0% of divorced households are in this lower wealth band. In contrast, 50.0% of married households have more than £500,000 of total wealth, but only 23.0% of divorced households have this much.

Wealth of Men vs Women After Divorce
While divorces in the UK typically aim for a 50/50 split, the data shows that divorced men generally have more wealth than divorced women. This could be due to a number of factors, from pensions not being included in divorce assets to the fact that men might earn more after the divorce than women. Women are more likely to have taken a career break or work part time in order to care for children, which not only affects their pension savings during the marriage but also impacts the ability to earn at the same rate as their husbands after the divorce.
As you can see in the table and chart below, divorced women have less wealth overall than divorced men. The table shows the median wealth for divorced people—the 'median' represents the midpoint, that is, half of people have less and half of people have more. The median wealth for divorced women is somewhere between £85,000 and £200,000. The median wealth for divorced men is between £200,000 and £300,000.
| Median Household Wealth of Divorced People | Lower End of Range | Upper End of Range |
|---|---|---|
| Divorced Women | £85,000 | £200,000 |
| Divorced Men | £200,000 | £300,000 |
The final chart below provides a bit more insight into these figures. As you can see circled in red, divorced woman are noticeably more likely to have wealth in the sub-£20,000 range. In contrast, divorced men are noticeably more likely to have wealth of £1 million or more.

Note: This article reflects the most-recent, current data available as of January 2026, which reflects marriages and divorces through 2023.