How Dangerous Is Cycling?
Despite the media's efforts to paint cyclists as the Antichrist of Britain's roads and the consensus amongst drivers that all cyclists should be banned from them, cycling has consistently been on the rise since the 1990's.
In contrast to the danger presented by motorbikes, bicycles are relatively safe—cycling poses little risk to cyclists, pedestrians, and other road users despite UK cycle safety falling behind many European countries due to our poor road infrastructure. Let's look at some of the statistics from the Department for Transport to understand the risks involved for cyclists in Britain. And remember that bicycle insurance can help provide financial assistance if you're injured in a cycling accident.
Likelihood of Getting in a Bicycle Accident
In 2022, there were 15,693 reported pedal cycle casualties in Britain. Of those 15,693 casualties, 4,056 were considered "serious" and 91 culminated in a fatality.
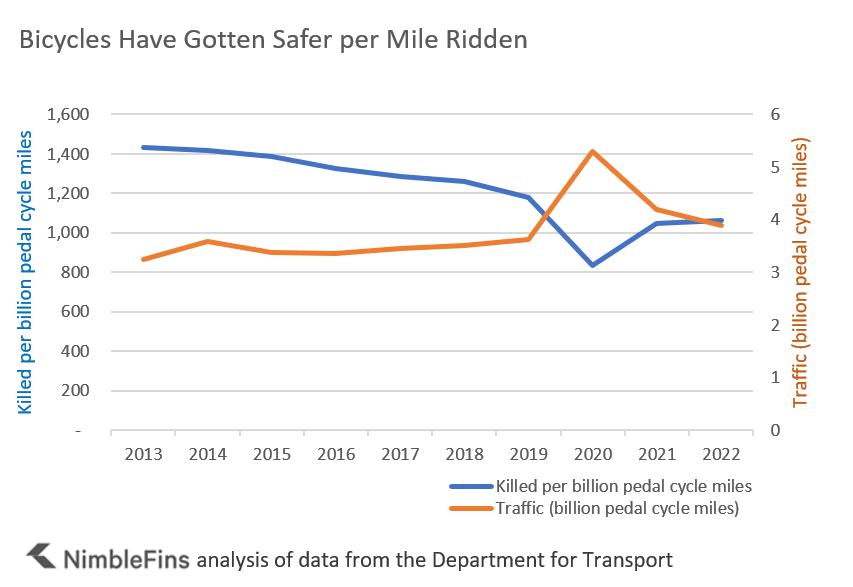
In the ten years to 2022, the number of cycling casualties has decreased by 19% overall, with 17% fewer cyclists killed and 11% fewer serious injuries. This despite consistent growth in cyclist numbers.
| Number of Reported Pedal Cycle Casualties | Killed | Serious | Slight | All |
|---|---|---|---|---|
| 2013 | 109 | 4,540 | 14,789 | 19,438 |
| 2014 | 113 | 4,971 | 16,203 | 21,287 |
| 2015 | 100 | 4,574 | 14,170 | 18,844 |
| 2016 | 102 | 4,354 | 14,021 | 18,477 |
| 2017 | 101 | 4,351 | 13,869 | 18,321 |
| 2018 | 99 | 4,342 | 13,109 | 17,550 |
| 2019 | 100 | 4,181 | 12,602 | 16,883 |
| 2020 | 141 | 4,281 | 11,872 | 16,294 |
| 2021 | 111 | 4,296 | 12,051 | 16,458 |
| 2022 | 91 | 4,056 | 11,546 | 15,693 |
| Change ten years to 2022 | -17% | -11% | -22% | -19% |
In fact, according to figures, bicycles have gotten noticeably safer per mile ridden—the number of cyclists killed per billion pedal cycle miles has fallen whilst traffic per billion pedal cycle miles has risen.
Which Vehicles Are Most Dangerous for Cyclists?
Collisions involving buses and HGVs are most likely to be fatal or serious. In fact, a cyclist who is a casualty in a road traffic accident with a High Goods Vehicle is 5.8% likely to die and 32% likely to be seriously injured.

However, due to raw numbers, more cyclists are KSI by cars—there are far more cars on the road than HGVs and cyclists are unlikely to come across an HGV unless they are cycling on major roads such as dual carriageways and A-roads.
Cycle Accident Figures by Collision Vehicle
The majority of cycling casualties are from collisions only involving bicycles. In 2022, 15,693 casualties resulted from cycle-only crashes. Of these, 627 were single-bike accidents (e.g. a cyclist falling due to slippery roads without any other bike or vehicle involved)—and of these, 295 cyclists ended up killed or seriously injured. Bike-only casualties most often involved two bikes.
2022 Cycle-only casualties (only bicycles involved, no other vehicles)
- 1 bicycle: 627 casualties, of which 295 KSI
- 2 bicycles: 14,577 casualties, of which 3,699 KSI
- 3+ bicycles: 489 casualties, of which 152 KSI
The second-most common vehicle involved in cycling casualties is cars, not surprisingly. Although despite making up around 80% of traffic on Britain's roads and being involved in 42% of cycle casualties, cars only account for 29% of cyclist fatalities.
The Most Dangerous Motor Vehicles for Bicyclists
| 2022 Casualties | All casualties | KSI (adjusted) | Killed |
|---|---|---|---|
| Pedal cycles | 15,693 | 4,147 | 91 |
| Motorcycles | 369 | 76 | - |
| Cars | 12,484 | 3,116 | 51 |
| Light goods vehicles | 1,393 | 391 | 12 |
| Buses or coaches | 212 | 69 | 5 |
| Heavy goods vehicles | 210 | 75 | 6 |

Buses and HGVs are involved in fewer overall casualties, but they are more dangerous when they happen.
What Causes Bicycle Accidents?
According to the Department for Transport, the vast majority of bicycle collisions involve a junction (70%)—so take particular care at junctions!

Turning right or left, as well as moving off, are also problematic manoeuvres for cyclists.
Making the Roads Safer for Cyclists
Whilst relatively safe, cycling, particularly on busy roads and in busy cities, carries an inherent level of risk. To catch up with our continental neighbours, the government, at both a national and local level, must take steps to ensure and promote safer cycling.
Some major cities have already began to implement measures, a notable example being the so-called £7.9 million "cycle superhighway" in Leeds City Centre and Manchester's £1.5 billion masterplan to create the UK's "biggest cycling and walking network".
Last but not least, it's important to keep your bicycle properly maintained to avoid preventable accidents due to equipment failure.