NimbleFins finds the areas with the best rental yields in England
NimbleFins analsysed data from the Office for National Statistics to find the local areas in England with the best rental yields. We calculated figures for over 300 local authorities and then ranked them to see how they compare. Here's what we found.
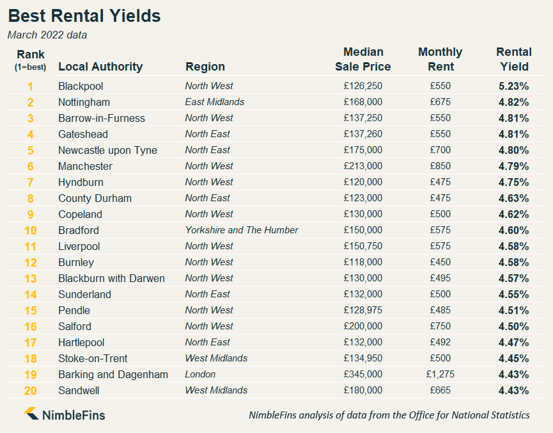
Highest Rental Yields
The north of England dominates the ranking for best rental yields, with areas in the North East and North West taking 15 out of the top 20 spots. Blackpool was #1, with a median rental yield of 5.2%. The second best was actually in the East Midlands—Nottingham—with a rental yield of 4.82%. Just behind that were Barrow-in-Furness and Gateshead, in the North West and North East, respectively, both with rental yields of 4.81%. Newcastle, Manchester, Hyndburn, County Durham, Copeland and Bradford rounded out the top ten. Bradford's rental yield was 4.6%, so all of the top 10 local areas had yields greater than this.
Lowest Rental Yields
The worst rental yield could be found in Kensington and Chelsea (2.1%). The south of England generally produced lower yields, with 7 of the bottom 20 local authorities hailing from London and another 7 from the South East. After Kensington and Chelsea, the worst 5 yields were found in Elmbridge, Mole Valley, St Albans and Richmond upon Thames (2.6% rental yield).

Map
Click and hover over the different local authorities in the map below to view the local authority name and the median rental yield. You can also zoom in; to move around the map once you're zoomed in, click the play arrow then the NSWE arrows.
Rental Yields by Region
As mentioned above, the north of England sports the best rental yields. But it's not just that they dominate the top 20— we calculated a weighted average rental yield for each region and found that the North East has the best yields, delivering a median rental yield of 4.3%. The North West rate was 4.0%.
The worst regions for rental yields were London and the South East, both delivering median yields of 3.2% on average.
| Region | Average Rental Yield |
|---|---|
| North East | 4.3% |
| North West | 4.0% |
| Yorkshire and The Humber | 3.9% |
| West Midlands | 3.7% |
| East Midlands | 3.6% |
| South West | 3.4% |
| East of England | 3.3% |
| London | 3.2% |
| South East | 3.2% |
Methodology
To calculate rental yields for a local area, we took the median monthly rental cost, multiplied it by 12, and divided by the median home sale price in an area.
To calculate rental yields for a region, we took the weighted average of the local rental yields (weighting by the housing stock in each local area, so that areas with more properties carried more weight).
Raw data for median monthly rental costs and median sale prices were found at the Office for National Statistics and is as of March 2022; housing stock figures were found at gov.uk.
Data
Here is a table with all of the data, sorted by local authority name so you can find yields in any local areas that you're interested in:
| Local Area | Region | Median Sale Price | Median Monthly Rent | Rental Yield |
|---|---|---|---|---|
| Adur | South East | £365,000 | £906 | 3.0% |
| Allerdale | North West | £155,000 | £495 | 3.8% |
| Amber Valley | East Midlands | £196,000 | £590 | 3.6% |
| Arun | South East | £321,000 | £825 | 3.1% |
| Ashfield | East Midlands | £170,000 | £575 | 4.1% |
| Ashford | South East | £316,000 | £875 | 3.3% |
| Babergh | East of England | £315,000 | £775 | 3.0% |
| Barking and Dagenham | London | £345,000 | £1,275 | 4.43% |
| Barnet | London | £585,000 | £1,350 | 2.8% |
| Barnsley | Yorkshire and The Humber | £140,000 | £475 | 4.1% |
| Barrow-in-Furness | North West | £137,250 | £550 | 4.81% |
| Basildon | East of England | £330,000 | £1,000 | 3.6% |
| Basingstoke and Deane | South East | £325,000 | £900 | 3.3% |
| Bassetlaw | East Midlands | £179,000 | £550 | 3.7% |
| Bath and North East Somerset | South West | £360,500 | £1,050 | 3.5% |
| Bedford | East of England | £300,000 | £825 | 3.3% |
| Bexley | London | £393,700 | £1,168 | 3.6% |
| Birmingham | West Midlands | £210,000 | £725 | 4.1% |
| Blaby | East Midlands | £253,500 | £750 | 3.6% |
| Blackburn with Darwen | North West | £130,000 | £495 | 4.57% |
| Blackpool | North West | £126,250 | £550 | 5.23% |
| Bolsover | East Midlands | £150,000 | £498 | 4.0% |
| Bolton | North West | £162,500 | £575 | 4.2% |
| Boston | East Midlands | £180,000 | £625 | 4.2% |
| Bournemouth, Christchurch and Poole | South West | £315,000 | £850 | 3.2% |
| Bracknell Forest | South East | £370,000 | £950 | 3.1% |
| Bradford | Yorkshire and The Humber | £150,000 | £575 | 4.60% |
| Braintree | East of England | £309,995 | £850 | 3.3% |
| Breckland | East of England | £250,000 | £725 | 3.5% |
| Brent | London | £535,000 | £1,450 | 3.3% |
| Brentwood | East of England | £475,000 | £1,150 | 2.9% |
| Brighton and Hove | South East | £392,556 | £1,100 | 3.4% |
| Bristol | South West | £313,360 | £1,125 | 4.3% |
| Broadland | East of England | £280,000 | £775 | 3.3% |
| Bromley | London | £497,750 | £1,300 | 3.1% |
| Bromsgrove | West Midlands | £315,000 | £725 | 2.8% |
| Broxbourne | East of England | £390,000 | £1,100 | 3.4% |
| Broxtowe | East Midlands | £215,000 | £675 | 3.8% |
| Buckinghamshire | South East | £425,000 | £1,050 | 3.0% |
| Burnley | North West | £118,000 | £450 | 4.58% |
| Bury | North West | £213,000 | £650 | 3.7% |
| Calderdale | Yorkshire and The Humber | £162,500 | £525 | 3.9% |
| Cambridge | East of England | £455,000 | £1,200 | 3.2% |
| Camden | London | £755,000 | £1,750 | 2.8% |
| Cannock Chase | West Midlands | £192,500 | £625 | 3.9% |
| Canterbury | South East | £335,000 | £875 | 3.1% |
| Carlisle | North West | £143,550 | £475 | 4.0% |
| Castle Point | East of England | £338,000 | £975 | 3.5% |
| Central Bedfordshire | East of England | £325,000 | £875 | 3.2% |
| Charnwood | East Midlands | £240,000 | £595 | 3.0% |
| Chelmsford | East of England | £375,000 | £950 | 3.0% |
| Cheltenham | South West | £290,000 | £800 | 3.3% |
| Cherwell | South East | £325,000 | £975 | 3.6% |
| Cheshire East | North West | £250,000 | £700 | 3.4% |
| Cheshire West and Chester | North West | £228,875 | £675 | 3.5% |
| Chesterfield | East Midlands | £176,000 | £594 | 4.1% |
| Chichester | South East | £400,000 | £950 | 2.9% |
| Chorley | North West | £188,000 | £600 | 3.8% |
| City of London | London | £790,000 | £1,755 | 2.7% |
| Colchester | East of England | £300,000 | £850 | 3.4% |
| Copeland | North West | £130,000 | £500 | 4.62% |
| Cornwall | South West | £270,000 | £715 | 3.2% |
| Cotswold | South West | £396,750 | £925 | 2.8% |
| County Durham | North East | £123,000 | £475 | 4.63% |
| Coventry | West Midlands | £205,000 | £730 | 4.3% |
| Craven | Yorkshire and The Humber | £235,000 | £595 | 3.0% |
| Crawley | South East | £310,000 | £1,033 | 4.0% |
| Croydon | London | £408,250 | £1,200 | 3.5% |
| Dacorum | East of England | £420,500 | £1,100 | 3.1% |
| Darlington | North East | £142,500 | £475 | 4.0% |
| Dartford | South East | £335,000 | £1,075 | 3.9% |
| Derby | East Midlands | £182,750 | £625 | 4.1% |
| Derbyshire Dales | East Midlands | £283,975 | £725 | 3.1% |
| Doncaster | Yorkshire and The Humber | £150,000 | £525 | 4.2% |
| Dorset | South West | £325,000 | £800 | 3.0% |
| Dover | South East | £280,000 | £725 | 3.1% |
| Dudley | West Midlands | £200,000 | £630 | 3.8% |
| Ealing | London | £525,000 | £1,400 | 3.2% |
| East Cambridgeshire | East of England | £315,250 | £800 | 3.0% |
| East Devon | South West | £305,000 | £750 | 3.0% |
| East Hampshire | South East | £400,000 | £900 | 2.7% |
| East Hertfordshire | East of England | £415,000 | £1,095 | 3.2% |
| East Lindsey | East Midlands | £199,950 | £525 | 3.2% |
| East Riding of Yorkshire | Yorkshire and The Humber | £200,000 | £550 | 3.3% |
| East Staffordshire | West Midlands | £205,000 | £625 | 3.7% |
| East Suffolk | East of England | £267,500 | £625 | 2.8% |
| Eastbourne | South East | £272,000 | £825 | 3.6% |
| Eastleigh | South East | £312,500 | £875 | 3.4% |
| Eden | North West | £225,000 | £575 | 3.1% |
| Elmbridge | South East | £650,000 | £1,300 | 2.4% |
| Enfield | London | £450,100 | £1,300 | 3.5% |
| Epping Forest | East of England | £496,000 | £1,250 | 3.0% |
| Epsom and Ewell | South East | £526,250 | £1,300 | 3.0% |
| Erewash | East Midlands | £188,500 | £625 | 4.0% |
| Exeter | South West | £275,000 | £850 | 3.7% |
| Fareham | South East | £320,000 | £883 | 3.3% |
| Fenland | East of England | £215,000 | £675 | 3.8% |
| Folkestone and Hythe | South East | £300,000 | £653 | 2.6% |
| Forest of Dean | South West | £263,000 | £678 | 3.1% |
| Fylde | North West | £212,500 | £585 | 3.3% |
| Gateshead | North East | £137,260 | £550 | 4.81% |
| Gedling | East Midlands | £210,000 | £650 | 3.7% |
| Gloucester | South West | £224,748 | £763 | 4.1% |
| Gosport | South East | £230,000 | £765 | 4.0% |
| Gravesham | South East | £335,000 | £900 | 3.2% |
| Great Yarmouth | East of England | £205,000 | £595 | 3.5% |
| Greenwich | London | £440,000 | £1,375 | 3.8% |
| Guildford | South East | £475,000 | £1,300 | 3.3% |
| Hackney | London | £600,000 | £1,600 | 3.2% |
| Halton | North West | £158,000 | £550 | 4.2% |
| Hambleton | Yorkshire and The Humber | £255,000 | £600 | 2.8% |
| Hammersmith and Fulham | London | £790,000 | £1,712 | 2.6% |
| Harborough | East Midlands | £310,000 | £750 | 2.9% |
| Haringey | London | £550,500 | £1,425 | 3.1% |
| Harlow | East of England | £305,000 | £1,123 | 4.42% |
| Harrogate | Yorkshire and The Humber | £300,000 | £750 | 3.0% |
| Harrow | London | £542,550 | £1,350 | 3.0% |
| Hart | South East | £425,000 | £1,000 | 2.8% |
| Hartlepool | North East | £132,000 | £492 | 4.47% |
| Hastings | South East | £275,000 | £725 | 3.2% |
| Havant | South East | £308,500 | £875 | 3.4% |
| Havering | London | £411,500 | £1,200 | 3.5% |
| Herefordshire | West Midlands | £265,000 | £650 | 2.9% |
| Hertsmere | East of England | £530,000 | £1,250 | 2.8% |
| High Peak | East Midlands | £218,000 | £550 | 3.0% |
| Hillingdon | London | £465,000 | £1,175 | 3.0% |
| Hinckley and Bosworth | East Midlands | £235,000 | £675 | 3.4% |
| Horsham | South East | £415,000 | £1,050 | 3.0% |
| Hounslow | London | £462,000 | £1,350 | 3.5% |
| Huntingdonshire | East of England | £285,000 | £800 | 3.4% |
| Hyndburn | North West | £120,000 | £475 | 4.75% |
| Ipswich | East of England | £223,000 | £700 | 3.8% |
| Isle of Wight | South East | £252,375 | £675 | 3.2% |
| Isles of Scilly | South West | £338,000 | £729 | 2.6% |
| Islington | London | £640,000 | £1,700 | 3.2% |
| Kensington and Chelsea | London | £1,275,000 | £2,199 | 2.1% |
| King's Lynn and West Norfolk | East of England | £250,000 | £695 | 3.3% |
| Kingston upon Hull, City of | Yorkshire and The Humber | £125,000 | £450 | 4.32% |
| Kingston upon Thames | London | £530,000 | £1,350 | 3.1% |
| Kirklees | Yorkshire and The Humber | £173,000 | £525 | 3.6% |
| Knowsley | North West | £159,975 | £575 | 4.3% |
| Lambeth | London | £550,000 | £1,600 | 3.5% |
| Lancaster | North West | £175,000 | £595 | 4.1% |
| Leeds | Yorkshire and The Humber | £215,000 | £750 | 4.2% |
| Leicester | East Midlands | £217,000 | £625 | 3.5% |
| Lewes | South East | £373,750 | £1,000 | 3.2% |
| Lewisham | London | £450,000 | £1,300 | 3.5% |
| Lichfield | West Midlands | £272,500 | £750 | 3.3% |
| Lincoln | East Midlands | £175,000 | £625 | 4.3% |
| Liverpool | North West | £150,750 | £575 | 4.58% |
| Luton | East of England | £280,000 | £825 | 3.5% |
| Maidstone | South East | £340,000 | £875 | 3.1% |
| Maldon | East of England | £350,000 | £895 | 3.1% |
| Malvern Hills | West Midlands | £307,000 | £700 | 2.7% |
| Manchester | North West | £213,000 | £850 | 4.79% |
| Mansfield | East Midlands | £162,000 | £595 | 4.41% |
| Medway | South East | £275,000 | £850 | 3.7% |
| Melton | East Midlands | £249,950 | £625 | 3.0% |
| Mendip | South West | £285,000 | £795 | 3.3% |
| Merton | London | £540,000 | £1,475 | 3.3% |
| Mid Devon | South West | £268,475 | £675 | 3.0% |
| Mid Suffolk | East of England | £290,000 | £775 | 3.2% |
| Mid Sussex | South East | £410,000 | £1,000 | 2.9% |
| Middlesbrough | North East | £130,000 | £450 | 4.2% |
| Milton Keynes | South East | £303,000 | £995 | 3.9% |
| Mole Valley | South East | £550,000 | £1,150 | 2.5% |
| New Forest | South East | £375,000 | £900 | 2.9% |
| Newark and Sherwood | East Midlands | £215,748 | £575 | 3.2% |
| Newcastle upon Tyne | North East | £175,000 | £700 | 4.80% |
| Newcastle-under-Lyme | West Midlands | £168,000 | £575 | 4.1% |
| Newham | London | £425,000 | £1,474 | 4.2% |
| North Devon | South West | £280,000 | £650 | 2.8% |
| North East Derbyshire | East Midlands | £202,000 | £600 | 3.6% |
| North East Lincolnshire | Yorkshire and The Humber | £144,000 | £475 | 4.0% |
| North Hertfordshire | East of England | £382,650 | £950 | 3.0% |
| North Kesteven | East Midlands | £227,000 | £650 | 3.4% |
| North Lincolnshire | Yorkshire and The Humber | £160,000 | £525 | 3.9% |
| North Norfolk | East of England | £290,000 | £650 | 2.7% |
| North Northamptonshire | East Midlands | £230,000 | £718 | 3.7% |
| North Somerset | South West | £290,000 | £800 | 3.3% |
| North Tyneside | North East | £170,000 | £575 | 4.1% |
| North Warwickshire | West Midlands | £240,000 | £695 | 3.5% |
| North West Leicestershire | East Midlands | £235,000 | £650 | 3.3% |
| Northumberland | North East | £171,000 | £500 | 3.5% |
| Norwich | East of England | £219,000 | £750 | 4.1% |
| Nottingham | East Midlands | £168,000 | £675 | 4.82% |
| Nuneaton and Bedworth | West Midlands | £203,000 | £625 | 3.7% |
| Oadby and Wigston | East Midlands | £248,000 | £795 | 3.8% |
| Oldham | North West | £169,950 | £595 | 4.2% |
| Oxford | South East | £430,000 | £1,275 | 3.6% |
| Pendle | North West | £128,975 | £485 | 4.51% |
| Peterborough | East of England | £220,000 | £725 | 4.0% |
| Plymouth | South West | £195,000 | £625 | 3.8% |
| Portsmouth | South East | £239,998 | £800 | 4.0% |
| Preston | North West | £155,000 | £550 | 4.3% |
| Reading | South East | £318,000 | £950 | 3.6% |
| Redbridge | London | £490,000 | £1,250 | 3.1% |
| Redcar and Cleveland | North East | £140,000 | £495 | 4.2% |
| Redditch | West Midlands | £232,000 | £695 | 3.6% |
| Reigate and Banstead | South East | £450,000 | £1,050 | 2.8% |
| Ribble Valley | North West | £240,250 | £650 | 3.2% |
| Richmond upon Thames | London | £748,500 | £1,600 | 2.6% |
| Richmondshire | Yorkshire and The Humber | £235,000 | £575 | 2.9% |
| Rochdale | North West | £165,000 | £550 | 4.0% |
| Rochford | East of England | £365,000 | £995 | 3.3% |
| Rossendale | North West | £165,000 | £550 | 4.0% |
| Rother | South East | £336,885 | £850 | 3.0% |
| Rotherham | Yorkshire and The Humber | £163,000 | £525 | 3.9% |
| Rugby | West Midlands | £252,000 | £695 | 3.3% |
| Runnymede | South East | £440,000 | £1,150 | 3.1% |
| Rushcliffe | East Midlands | £290,000 | £740 | 3.1% |
| Rushmoor | South East | £325,000 | £900 | 3.3% |
| Rutland | East Midlands | £287,500 | £805 | 3.4% |
| Ryedale | Yorkshire and The Humber | £247,000 | £650 | 3.2% |
| Salford | North West | £200,000 | £750 | 4.50% |
| Sandwell | West Midlands | £180,000 | £665 | 4.43% |
| Scarborough | Yorkshire and The Humber | £182,250 | £550 | 3.6% |
| Sedgemoor | South West | £245,000 | £675 | 3.3% |
| Sefton | North West | £196,000 | £595 | 3.6% |
| Selby | Yorkshire and The Humber | £220,000 | £600 | 3.3% |
| Sevenoaks | South East | £446,000 | £1,350 | 3.6% |
| Sheffield | Yorkshire and The Humber | £180,000 | £625 | 4.2% |
| Shropshire | West Midlands | £250,000 | £625 | 3.0% |
| Slough | South East | £347,750 | £950 | 3.3% |
| Solihull | West Midlands | £310,750 | £850 | 3.3% |
| Somerset West and Taunton | South West | £257,750 | £725 | 3.4% |
| South Cambridgeshire | East of England | £385,000 | £1,050 | 3.3% |
| South Derbyshire | East Midlands | £218,750 | £653 | 3.6% |
| South Gloucestershire | South West | £300,000 | £950 | 3.8% |
| South Hams | South West | £350,000 | £775 | 2.7% |
| South Holland | East Midlands | £220,000 | £650 | 3.5% |
| South Kesteven | East Midlands | £239,950 | £625 | 3.1% |
| South Lakeland | North West | £251,250 | £675 | 3.2% |
| South Norfolk | East of England | £280,000 | £750 | 3.2% |
| South Oxfordshire | South East | £425,000 | £1,100 | 3.1% |
| South Ribble | North West | £180,000 | £595 | 4.0% |
| South Somerset | South West | £250,000 | £675 | 3.2% |
| South Staffordshire | West Midlands | £250,000 | £733 | 3.5% |
| South Tyneside | North East | £140,000 | £495 | 4.2% |
| Southampton | South East | £238,000 | £800 | 4.0% |
| Southend-on-Sea | East of England | £322,000 | £825 | 3.1% |
| Southwark | London | £538,750 | £1,600 | 3.6% |
| Spelthorne | South East | £420,000 | £1,150 | 3.3% |
| St Albans | East of England | £590,000 | £1,250 | 2.5% |
| St. Helens | North West | £155,000 | £550 | 4.3% |
| Stafford | West Midlands | £220,000 | £645 | 3.5% |
| Staffordshire Moorlands | West Midlands | £190,000 | £575 | 3.6% |
| Stevenage | East of England | £310,000 | £925 | 3.6% |
| Stockport | North West | £266,000 | £725 | 3.3% |
| Stockton-on-Tees | North East | £150,000 | £530 | 4.2% |
| Stoke-on-Trent | West Midlands | £134,950 | £500 | 4.45% |
| Stratford-on-Avon | West Midlands | £330,000 | £795 | 2.9% |
| Stroud | South West | £305,000 | £710 | 2.8% |
| Sunderland | North East | £132,000 | £500 | 4.55% |
| Surrey Heath | South East | £440,000 | £1,000 | 2.7% |
| Sutton | London | £425,000 | £1,100 | 3.1% |
| Swale | South East | £280,000 | £850 | 3.6% |
| Swindon | South West | £239,000 | £750 | 3.8% |
| Tameside | North West | £178,000 | £625 | 4.2% |
| Tamworth | West Midlands | £215,000 | £715 | 4.0% |
| Tandridge | South East | £475,000 | £1,200 | 3.0% |
| Teignbridge | South West | £280,000 | £725 | 3.1% |
| Telford and Wrekin | West Midlands | £200,000 | £610 | 3.7% |
| Tendring | East of England | £256,500 | £795 | 3.7% |
| Test Valley | South East | £330,000 | £975 | 3.5% |
| Tewkesbury | South West | £280,000 | £863 | 3.7% |
| Thanet | South East | £285,000 | £750 | 3.2% |
| Three Rivers | East of England | £493,250 | £1,250 | 3.0% |
| Thurrock | East of England | £320,000 | £950 | 3.6% |
| Tonbridge and Malling | South East | £375,000 | £1,058 | 3.4% |
| Torbay | South West | £235,000 | £650 | 3.3% |
| Torridge | South West | £263,750 | £645 | 2.9% |
| Tower Hamlets | London | £532,100 | £1,575 | 3.6% |
| Trafford | North West | £320,000 | £895 | 3.4% |
| Tunbridge Wells | South East | £410,000 | £1,000 | 2.9% |
| Uttlesford | East of England | £427,750 | £1,075 | 3.0% |
| Vale of White Horse | South East | £365,000 | £1,025 | 3.4% |
| Wakefield | Yorkshire and The Humber | £171,500 | £575 | 4.0% |
| Walsall | West Midlands | £185,000 | £625 | 4.1% |
| Waltham Forest | London | £500,000 | £1,300 | 3.1% |
| Wandsworth | London | £652,500 | £1,750 | 3.2% |
| Warrington | North West | £225,000 | £650 | 3.5% |
| Warwick | West Midlands | £320,000 | £870 | 3.3% |
| Watford | East of England | £392,000 | £1,175 | 3.6% |
| Waverley | South East | £515,000 | £1,150 | 2.7% |
| Wealden | South East | £365,000 | £975 | 3.2% |
| Welwyn Hatfield | East of England | £415,000 | £1,100 | 3.2% |
| West Berkshire | South East | £365,000 | £945 | 3.1% |
| West Devon | South West | £275,000 | £675 | 2.9% |
| West Lancashire | North West | £197,500 | £548 | 3.3% |
| West Lindsey | East Midlands | £208,000 | £595 | 3.4% |
| West Northamptonshire | East Midlands | £268,000 | £750 | 3.4% |
| West Oxfordshire | South East | £347,500 | £1,000 | 3.5% |
| West Suffolk | East of England | £270,000 | £950 | 4.2% |
| Westminster | London | £900,000 | £2,000 | 2.7% |
| Wigan | North West | £160,000 | £525 | 3.9% |
| Wiltshire | South West | £297,000 | £800 | 3.2% |
| Winchester | South East | £460,000 | £995 | 2.6% |
| Windsor and Maidenhead | South East | £510,000 | £1,200 | 2.8% |
| Wirral | North West | £190,000 | £575 | 3.6% |
| Woking | South East | £426,000 | £1,150 | 3.2% |
| Wokingham | South East | £450,000 | £1,100 | 2.9% |
| Wolverhampton | West Midlands | £179,000 | £625 | 4.2% |
| Worcester | West Midlands | £221,500 | £650 | 3.5% |
| Worthing | South East | £330,000 | £850 | 3.1% |
| Wychavon | West Midlands | £295,000 | £745 | 3.0% |
| Wyre | North West | £171,000 | £595 | 4.2% |
| Wyre Forest | West Midlands | £217,250 | £600 | 3.3% |
| York | Yorkshire and The Humber | £275,000 | £800 | 3.5% |