Average Household Savings & Wealth UK 2024
Savings are critical both in the short and long term, to help households weather emergencies and eventually fund the retirement you want. When thinking about how much to save, we often first wonder how much other people save. To get some clarification on this, we dug into data from the Office for National Statistics' Wealth and Assets Survey.
Below we'll explain how much households save each month and each year, as well as break down overall savings and wealth levels. Including by different age groups. Find out how much your peers have saved compared to you. Note, most of the data in this article reflects household savings, not individual savings. For insight into wealth per adult, see the last section.
Average Household Savings UK
The average savings in the UK is £76,301 per household. This figure reflects all gross 'financial wealth' such as current and savings accounts, ISAs, shares, bonds, trusts and other formal financial assets.
However, most households have less savings than this, since the 'average' figure is skewed up by a small number of households with very high savings levels. For this reason it can be more useful to consider the 'median'—50% of household have less than the median amount saved, and 50% of households have more. The median household gross savings in the UK is £12,500 (up from £11,000 two years ago). But 25% of households have less than £2,100 saved.
Note: these are 'gross' figures which reflect assets, but do not take into account financial liabilities, like overdrafts and unpaid balances on credit cards. We discuss net financial wealth figures later in the section on savings by age.
| How much does the average person have in savings UK? | |
|---|---|
| 25th percentile point | £2,100 |
| Median - 50th percentile point | £12,500 |
| 75th percentile point | £58,500 |
| Average | £76,301 |

Types of household savings
When households do have savings, how much of each type do they have? Of households with savings accounts, the median amount saved in those accounts is £5,500.
Of households with ISAs, the median amount saved is £9,200 in cash ISAs and £31,000 in stocks and shares ISAs. More people have cash ISAs than shares ISAs. Of those with fixed term bonds, the median amount is £25,000. And the figure is £40,000 for unit/investment trusts. All of these figures reflect households with each type of asset and exclude households without each type of asset.
| Typical savings for households with formal financial assets | Median Amount | |
|---|---|---|
All current accounts | £2,000 | |
| Current accounts in credit | £2,000 | |
| Current accounts in overdraft | £400 | |
Savings accounts | £5,500 | |
ISAs | £12,000 | |
| Cash ISAs | £9,200 | |
| Stocks and shares ISAs | £31,000 | |
| Lifetime ISAs | £5,000 | |
| Innovative Finance ISAs | £7,500 | |
National Savings certificates and bonds | £1,200 | |
UK shares | £5,000 | |
Insurance products | £43,000 | |
Fixed term bonds | £25,000 | |
Employee shares and share options | £5,000 | |
Unit/Investment trusts | £40,000 | |
Overseas shares | £9,500 | |
UK bonds/gilts | £16,000 | |
Other formal financial assets | £30,000 | |
Any formal financial asset including current accounts in credit | £11,200 |
Average savings per month UK
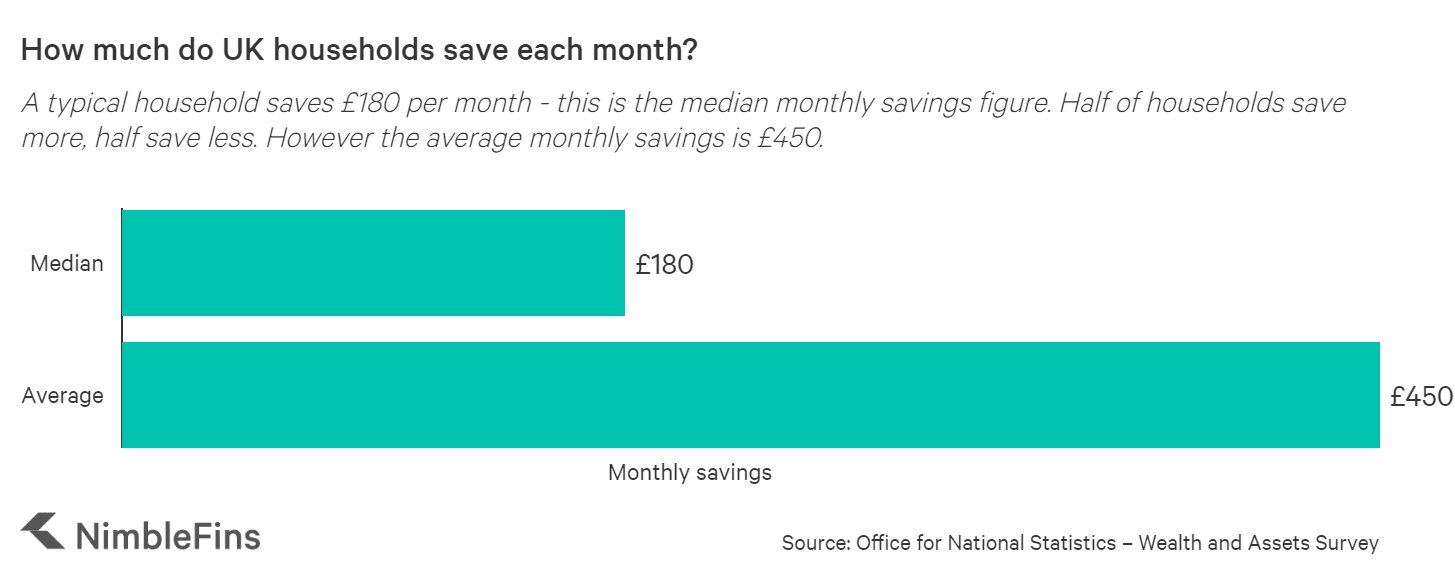
The typical UK household saves £180 per month—this represents the median amount saved each month. That means that 50% of households save less than £180 a month and 50% of households save more.
The average savings per month UK is £450 per household. This figure is higher than the median figure due to a small number of households with very high savings rates. For example, households in the top quintile of income save an average of £1,817 each month. In contrast, the bottom quintile of earners saves -£352 a month.
| How much do UK households save each month? | |
|---|---|
| Median (50% of households save more than this, 50% save less) | £180 |
| Mean (average) | £450 |
How much should I save each month?
The households saving ratio in the UK has averaged 8.7% over the past ten years. The household savings ratio is household savings as a proportion of household disposable (after-tax) income. The household saving ratio did jump up to 27.4% in Q2 2020 and 16.9% in Q3 2020, but these are not typical savings figures.
When thinking about how much you should save each month, it can be useful to know how much other households in your age group save as a proportion of their after-tax income—although it is up to you to decide how much to save given your situation. The table below shows median savings rates by age of the Household Reference Person (HRP):
| Savings rates by age | Median saving rate |
|---|---|
| Age of HRP: 0-34 | ( 0.13%) |
| Age of HRP: 35-44 | 9.1% |
| Age of HRP: 45-54 | 10.4% |
| Age of HRP: 55-64 | 8.5% |
| Age of HRP: 65-74 | 11.2% |
| Age of HRP: 75+ | 11.4% |
| Total Population | 8.8% |
Average savings per year UK
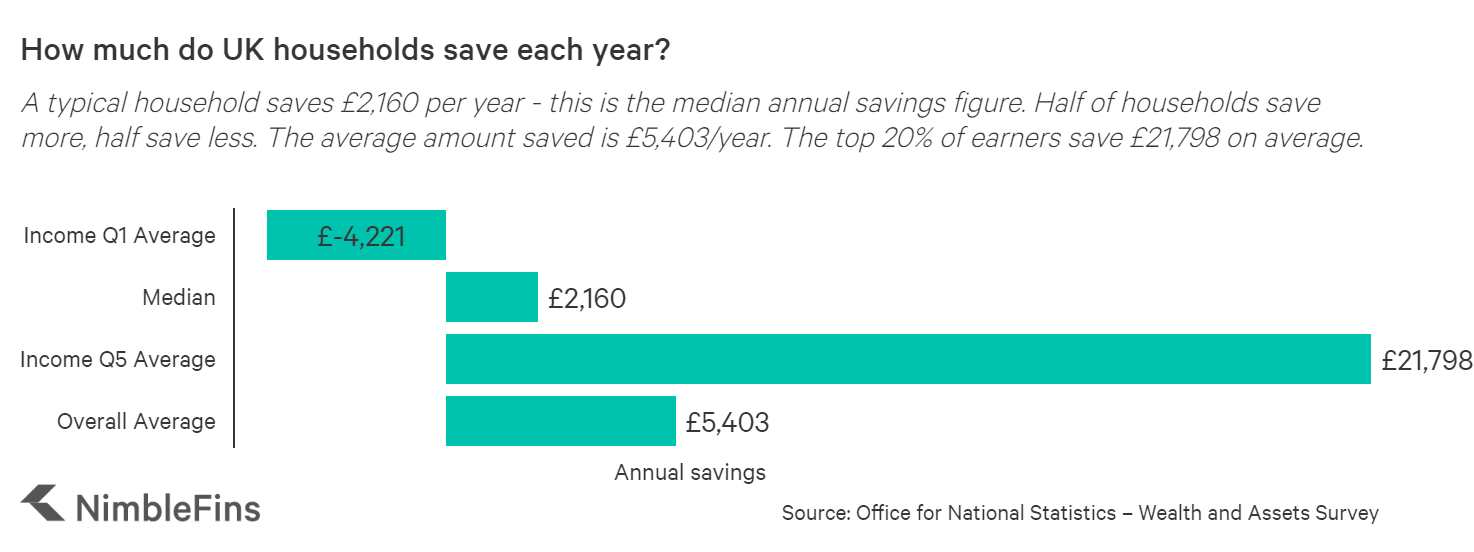
The typical UK household saves £2,160 per year—this represents the median amount saved annually, so half of households save less than £2,160 each year and half save more.
The average amount saved each year is £5,403 per household. This average figure is more than 2X higher than the median figure because a small number of households have very high savings rates. For example, households in the top quintile of income save an average of £21,798 each year. In contrast, the bottom quintile of earners saves -£4,221 a year.
| How much do UK households save each year? | |
|---|---|
| Median (50% of households save more than this, 50% save less) | £2,160 |
| Mean (average) | £5,403 |
Average household savings by age UK
Savings accounts: Five must-knows
- Usually no credit check
- £85,000 protected
- Interest rates won't be the same as the base rate
- Bank of England has the power
- Tax benefits
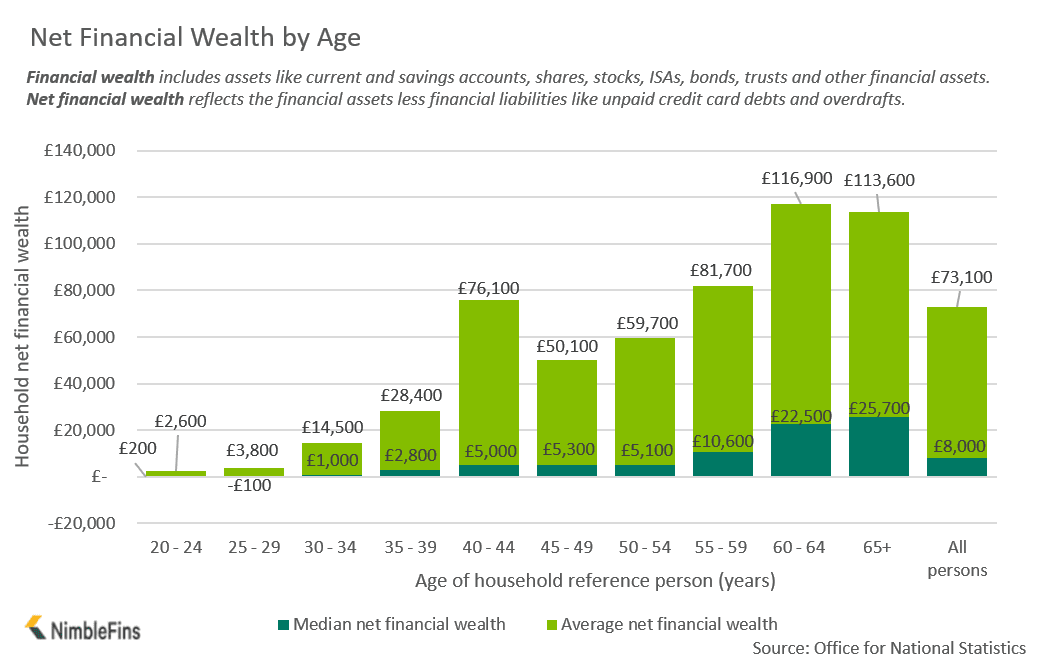
The age group with the highest level of average savings (i.e., financial wealth) are 60 to 64 year olds, achieving net financial wealth of £116,900 on average. However, if we look at "median" figures instead of "average" figures, then the "typical" household in this age group has just £22,500 of net financial wealth. Net financial wealth reflects savings via current and savings account, stocks, bonds, shares, trusts, ISAs, and other financial assets, less financial liabilities like unpaid credit card balances.
As discussed above, "average" figures are skewed upwards by a small proportion of households with very high levels of savings.
Here are stats on how much households have saved on average in different 5-year age brackets so you can compare your savings to that of your peers. (We used to show this data in 10-year age buckets but due to a reader request in the comments section we're now breaking out the data into 5-year buckets, which are more useful. Thank you to the reader who made this request!)
| Household savings by age UK | Average net financial wealth | Median net financial wealth |
|---|---|---|
| 20 to 24 | £2,600 | £200 |
| 25 to 29 | £3,800 | -£100 |
| 30 to 34 | £14,500 | £1,000 |
| 35 to 39 | £28,400 | £2,800 |
| 40 to 44 | £76,100 | £5,000 |
| 45 to 49 | £50,100 | £5,300 |
| 50 to 54 | £59,700 | £5,100 |
| 55 to 59 | £81,700 | £10,600 |
| 60 to 64 | £116,900 | £22,500 |
| 65+ | £113,600 | £25,700 |
| All persons | £73,100 | £8,000 |
Savings for renters vs home owners
According to the 2023 English Housing Survey, the proportion of households with savings increased from 64% in 2022 to 66% of households in 2023 in England.
Owner occupiers were the most likely to have savings, at 79% (12.3 million households). Those who owned outright were more likely to have savings (86%) than were those with a mortgage (71%). The proportion of those who owned outright with savings increased from 83% in 2021-22 to 87% in 2020-21.
Private renters (54%, 2.4 million households) were more likely to have savings than social renters (27%, 1.1 million households). The proportion of social and private renters with savings remained similar to 2022.
FAQs
The average savings (net financial wealth) at 25 - 29 years old is £3,800, but the typical person in that age range has -£100. But savings amounts vary quite a bit from one household to the next. This savings chart shows average savings for different ages.
The average UK savings for 30 - 34 year olds is around £14,500 of net financial wealth (savings like current and savings accounts, stocks, bonds, etc. less financial liabilities), but the median figure is just £1,000. Savings amounts vary quite a bit from one household to the next, and average figures are higher than median (typical) figures because a small number of households have a very high level of wealth, which pulls up the average. This savings chart shows average savings for different ages.
The average savings for households where the reference person is aged 40 - 44 years old is £76,100, but the median household savings in this age group is £5,000. You may need a different amount of savings. This savings chart shows average savings for different ages.
The average savings for households where the reference person is aged 55 - 59 years old is £81,700, but median savings are £10,600; for the 60 - 64 age bracket, these figures are £116,900 and £22,500, respectively. Your savings requirements may differ. This savings chart shows average savings for different ages.
Average retirement savings UK
How much does the average retiree have saved? Those aged 65 and over have an average total wealth of £730,900—£113,600 of which is 'savings' (i.e., financial wealth like current and savings accounts, ISAs, stock, bonds, trusts, etc.) and £275,600 of which is private pensions. However, the median amount of private pension wealth is £110,200 and the median savings is £25,700 (the median figures mean that half of households have more than this and half have less). This savings chart shows average savings for different ages.
| Retirement wealth age 65+ | Average | Median |
|---|---|---|
| Physical wealth | £57,300 | £45,000 |
| Property wealth (net) | £284,000 | £200,000 |
| Private pension wealth | £275,600 | £110,200 |
| Financial wealth (net) | £113,600 | £25,700 |
| Total wealth | £730,900 | £467,700 |
You might notice that the median total wealth does not equal the sum of the individual components (e.g. physical wealth, property wealth, etc.). This is because the sum of the medians does not equal the median of the sums. We give an example below if you want to learn more.
Average Wealth UK
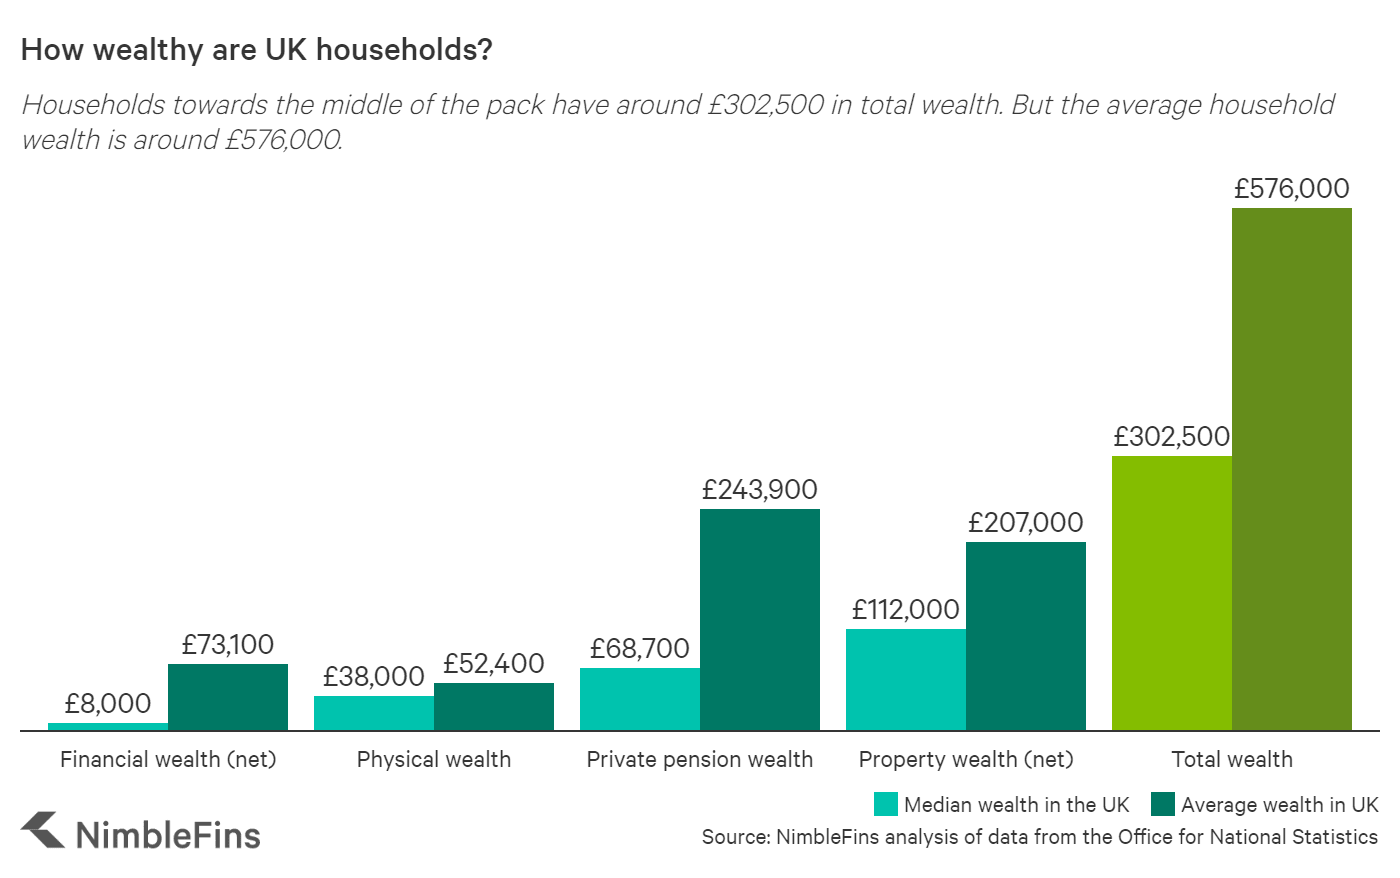
The typical UK household has £302,500 in total wealth—this figure represents the median total wealth figure, meaning half of households have less than this amount and half of household have more. Total wealth is composed of four different types of wealth:
- Financial wealth (net). The value of financial assets held including formal investments (e.g., current or saving accounts, investment vehicles such as ISAs, endowments, stocks and shares) and informal savings.
- Physical wealth. The self-reported value of owned household contents, possessions and valuables, including antiques, art, collections and any vehicles owned by individuals.
- Private pension wealth. The value of pension pots already accrued that are not state basic retirement or state earning related, including occupational pensions, personal pensions, retained rights in previous pensions and pensions in payment.
- Property wealth (net). The self-reported value of any property owned, including a main residence plus any other land or property owned in the UK or abroad.
The average household wealth is £576,000. The average figure is higher than the median figure because averages are skewed upwards when there are some very large data points. In this case, some households who are very wealthy make the average figures nearly 2X the median wealth figures.
Note: as one eagle-eyed reader mentioned to us, the median total wealth figure is not the same as the figure you'd get by adding up the median figures for each wealth category.
AVERAGE wealth by decile
Upon reader request in the comments section below (thank you!) we've run the numbers to show average total wealth by decile—that means we're showing the average wealth of people in the bottom 10% of wealth, the top 10%, and the 8 deciles in between. As you can see, the bottom 10% of households (the poorest) have around £4,700 in total wealth, while the top 10% (the richest) have nearly £2.5 million on average.
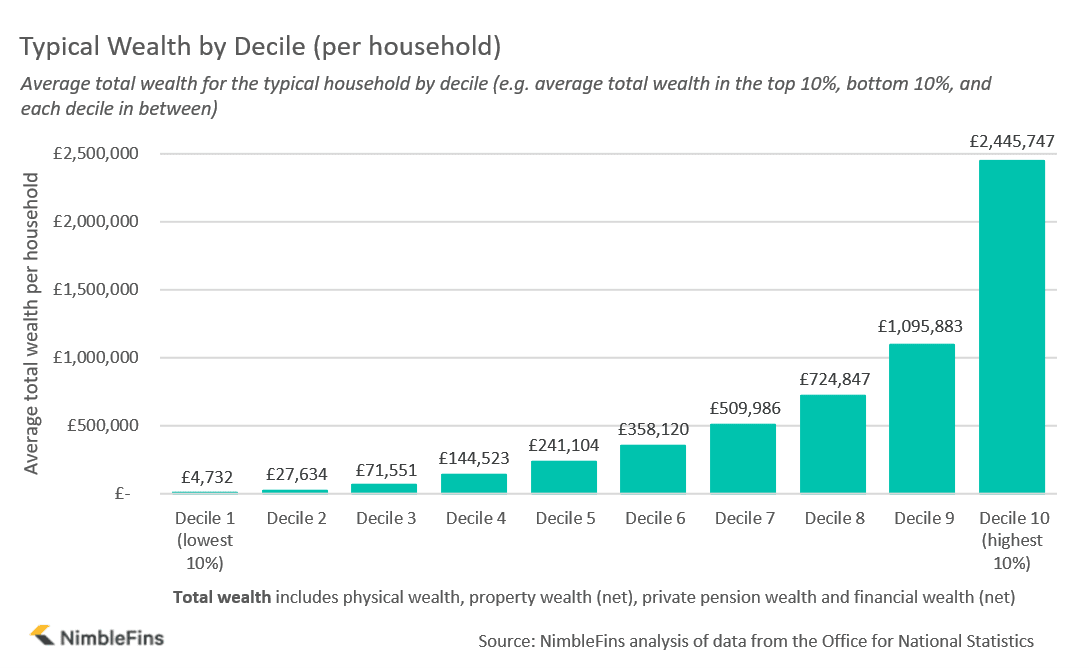
And here are the details, by type of wealth:
| Average Household Wealth | Physical Wealth | Property Wealth (net) | Private Pension Wealth | Financial Wealth (net) | Total Wealth |
|---|---|---|---|---|---|
| Decile 1 (lowest 10%) | £7,848 | -£166 | £1,471 | -£4,421 | £4,732 |
| Decile 2 | £19,551 | £776 | £6,895 | £413 | £27,634 |
| Decile 3 | £29,759 | £14,411 | £23,873 | £3,508 | £71,551 |
| Decile 4 | £35,205 | £52,605 | £49,211 | £7,502 | £144,523 |
| Decile 5 | £42,684 | £107,122 | £73,672 | £17,626 | £241,104 |
| Decile 6 | £49,903 | £167,780 | £113,822 | £26,615 | £358,120 |
| Decile 7 | £55,662 | £217,795 | £190,006 | £46,524 | £509,986 |
| Decile 8 | £69,316 | £297,833 | £287,627 | £70,071 | £724,847 |
| Decile 9 | £79,614 | £391,556 | £497,379 | £127,334 | £1,095,883 |
| Decile 10 (highest 10%) | £122,203 | £766,971 | £1,137,455 | £419,118 | £2,445,747 |
AVERAGE wealth by age UK
Here is a chart showing average household wealth by age, across the four components of wealth: physical wealth, property wealth, private pension wealth and financial wealth (i.e., savings). Remember, average figures are higher than "typical" or median figures, as they are skewed upwards by those with high levels of wealth.
It's important to point out that the figures reflect the average wealth of the household not per person.
| Average household wealth by age | Physical wealth | Property wealth (net) | Private pension wealth | Financial wealth (net) | Total wealth |
|---|---|---|---|---|---|
| 20 to 24 | £20,400 | £28,000 | £10,400 | £2,600 | £61,700 |
| 25 to 29 | £27,800 | £79,000 | £23,300 | £3,800 | £134,200 |
| 30 to 34 | £35,900 | £65,000 | £45,900 | £14,500 | £161,500 |
| 35 to 39 | £41,700 | £112,000 | £81,600 | £28,400 | £264,100 |
| 40 to 44 | £53,000 | £161,000 | £147,400 | £76,100 | £437,700 |
| 45 to 49 | £53,400 | £189,000 | £230,700 | £50,100 | £523,600 |
| 50 to 54 | £58,300 | £208,000 | £309,000 | £59,700 | £635,100 |
| 55 to 59 | £60,700 | £250,000 | £417,900 | £81,700 | £810,000 |
| 60 to 64 | £63,500 | £283,000 | £483,700 | £116,900 | £947,600 |
| 65+ years | £57,300 | £284,000 | £275,600 | £113,600 | £730,900 |

We've had a reader enquire about the average wealth per adult instead of per household. It's a great question. To estimate an answer, we adjusted the ONS household wealth data by the number of adults per household (which varies by age group) to arrive at approximate per-adult figures. Here are the results:
| Average wealth per adult | Physical wealth | Property wealth (net) | Private pension wealth | Financial wealth (net) | Total wealth |
|---|---|---|---|---|---|
| 20 to 24 | £10,625 | £14,583 | £5,417 | £1,354 | £32,135 |
| 25 to 29 | £15,618 | £44,382 | £13,090 | £2,135 | £75,393 |
| 30 to 34 | £20,169 | £36,517 | £25,787 | £8,146 | £90,730 |
| 35 to 39 | £23,167 | £62,222 | £45,333 | £15,778 | £146,722 |
| 40 to 44 | £29,444 | £89,444 | £81,889 | £42,278 | £243,167 |
| 45 to 49 | £25,673 | £90,865 | £110,913 | £24,087 | £251,731 |
| 50 to 54 | £28,029 | £100,000 | £148,558 | £28,702 | £305,337 |
| 55 to 59 | £30,350 | £125,000 | £208,950 | £40,850 | £405,000 |
| 60 to 64 | £31,750 | £141,500 | £241,850 | £58,450 | £473,550 |
| 65+ years | £35,813 | £177,500 | £172,250 | £71,000 | £456,563 |
| All persons | £28,185 | £111,343 | £131,191 | £39,320 | £309,824 |
MEDIAN wealth by age UK
We've had another reader request for the median wealth by age. Thank you for the request, and here it is. Remember, the median figures are considered to be more 'typical' because they are not skewed by the small number of people with a lot of wealth; the median means half of people have less and half have more. Let's start with the median figures per household:
| Median household wealth by age | Physical wealth | Property wealth (net) | Private pension wealth | Financial wealth (net) | Total wealth |
|---|---|---|---|---|---|
| 20 to 24 | £15,000 | £- | £1,000 | £200 | £23,400 |
| 25 to 29 | £20,200 | £- | £6,800 | -£100 | £45,400 |
| 30 to 34 | £25,800 | £22,000 | £19,000 | £1,000 | £100,300 |
| 35 to 39 | £31,200 | £47,000 | £24,800 | £2,800 | £155,300 |
| 40 to 44 | £37,000 | £82,000 | £53,600 | £5,000 | £243,400 |
| 45 to 49 | £42,000 | £101,000 | £88,100 | £5,300 | £317,000 |
| 50 to 54 | £45,000 | £131,000 | £107,400 | £5,100 | £403,900 |
| 55 to 59 | £46,000 | £160,000 | £179,100 | £10,600 | £495,500 |
| 60 to 64 | £48,300 | £190,000 | £254,000 | £22,500 | £623,000 |
| 65+ | £45,000 | £200,000 | £110,200 | £25,700 | £467,700 |
| All persons | £38,000 | £112,000 | £68,700 | £8,000 | £302,500 |
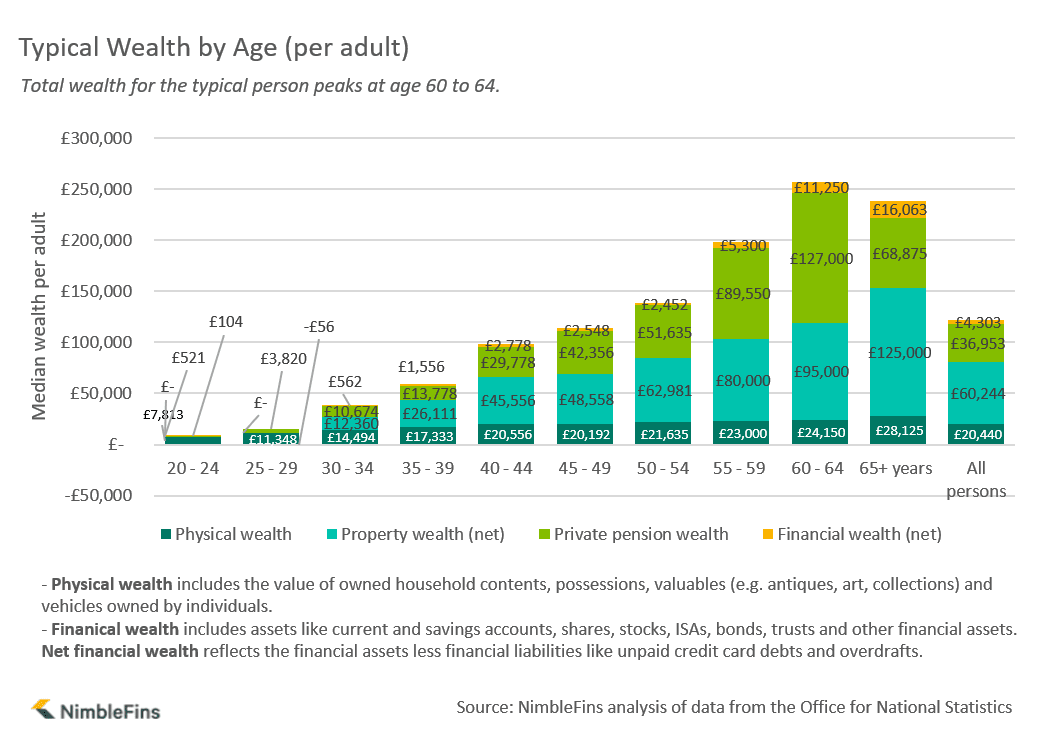
And here is the median wealth data by age approximated per adult—please remember these are approximations using the average number of adults per household by age from the last census. Regardless, they can provide a good indication of typical wealth patterns for the typical UK adult:
| Median wealth per adult | Physical wealth | Property wealth (net) | Private pension wealth | Financial wealth (net) | Total wealth |
|---|---|---|---|---|---|
| 20 to 24 | £7,813 | £- | £521 | £104 | £12,188 |
| 25 to 29 | £11,348 | £- | £3,820 | -£56 | £25,506 |
| 30 to 34 | £14,494 | £12,360 | £10,674 | £562 | £56,348 |
| 35 to 39 | £17,333 | £26,111 | £13,778 | £1,556 | £86,278 |
| 40 to 44 | £20,556 | £45,556 | £29,778 | £2,778 | £135,222 |
| 45 to 49 | £20,192 | £48,558 | £42,356 | £2,548 | £152,404 |
| 50 to 54 | £21,635 | £62,981 | £51,635 | £2,452 | £194,183 |
| 55 to 59 | £23,000 | £80,000 | £89,550 | £5,300 | £247,750 |
| 60 to 64 | £24,150 | £95,000 | £127,000 | £11,250 | £311,500 |
| 65+ | £28,125 | £125,000 | £68,875 | £16,063 | £292,313 |
| All persons | £20,440 | £60,244 | £36,953 | £4,303 | £162,711 |
Here is a chart displaying the typical (median) wealth by age per adult. Note, this differs in two ways from the chart in the previous section. First, it displays the median not the mean. And second, the figures are per adult not per household.
Median Wealth by Region
In response to a reader query (thanks Hezzer!), we've now broken out the data according to where people live. And there are some interesting takeaways—for instance, the poorest Londoners are the poorest in the UK.
First, let's look at total household wealth by region of the UK. The 'richest' region is the South East, where the 75th percentile (that is, those with more wealth than 75% of the households) have £1,058,000 in total wealth. This is greater than in London, where those in the 75th percentile of wealth have £902,400. The East of England ranks third for this metric, with £864,700 of total wealth.
How about people at the lower end of the wealth spectrum? Comparing those at the 25th percentile of wealth (that is, those with more than the bottom 25% and less than the top 75%), Londoners have the least—£32,200 of total wealth.
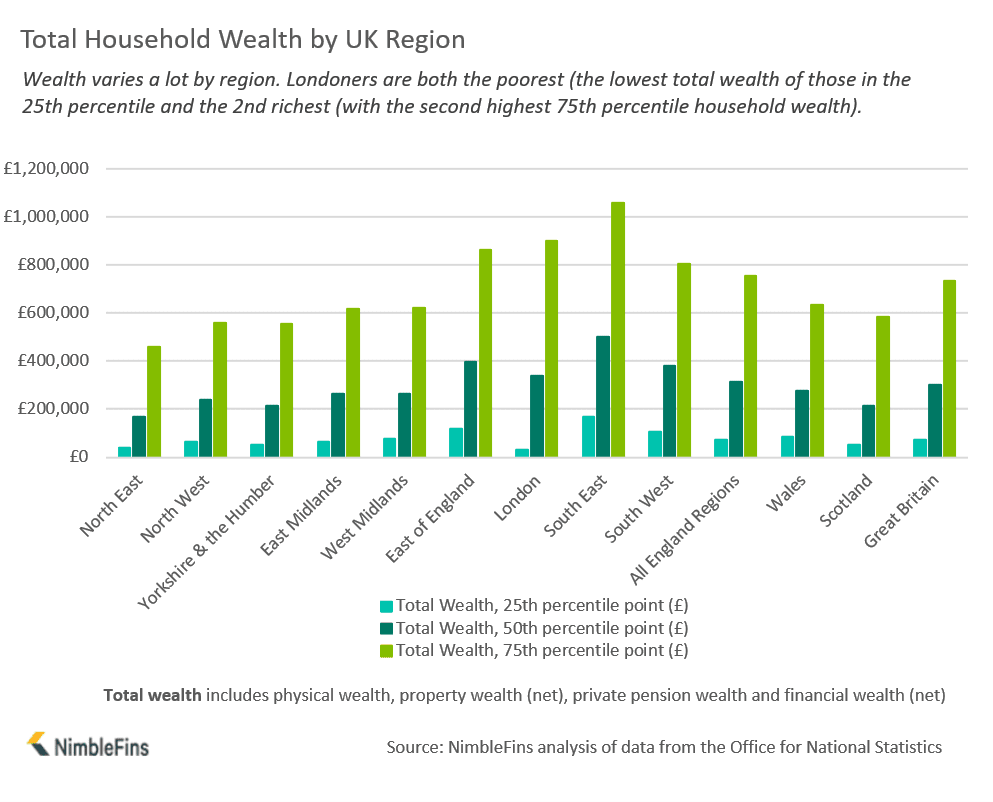
And how is a household's wealth allocated, depending on where they live? Not surprisingly, given the high cost of property in the capital, the biggest contributor to household wealth for Londoners is property (49% of total household wealth on average). But for the rest of the UK, private pensions are the bulk of a household's wealth.

Any questions about any of this data, feel free to leave a comment below or email us.
Median Example
We've had a few readers reach out asking why the total wealth figures don't equal the sum of the individual wealth components (e.g. financial wealth, physical wealth, etc.).
For the "mean" figures the small discrepancy between total and sum of the categories would be due to rounding.
But for the "median" figures, where there is a big difference between the total and the sum of the categories, this is because in math the sum of the medians does not equal the median of the sums. Here's an example:
| Person 1 | Person 2 | Person 3 | Median | |
|---|---|---|---|---|
| Financial wealth | 1 | 3 | 4 | 3 |
| Property wealth | 3 | 4 | 1 | 3 |
| Physical wealth | 4 | 1 | 3 | 3 |
| Private pension wealth | 4 | 3 | 1 | 3 |
| Total wealth | 12 | 11 | 9 | 11 |
The median for each type of wealth is 3. So the sum of the medians would be 12. But the total wealth figures per person are 12, 11 and 9—so the median of total wealth is actually 11 (not 12, which is the sum of the medians).
Best Savings & Investing Products
After reading all of this, you may be keen to boost your savings. Clearly, one way to do this is by cutting back on unnecessary spending—but a lot of people don't really have much frivolous spending. Or even if you do, sometimes we need a bit of that! So what else can you do?
You can look to financial products to see if there are new or better tools on the market compared to what you're using now. For instance, this can mean opening up a new savings account or swapping your savings into a higher-yielding account.
- Updated weekly
- Easy-access, notice, fixed, regular and sharia accounts
- Common questions explained
Some people may choose to start investing, but care needs to be taken here and investments can go up and down in value, so you could get back less than you put in. But companies like Hargreaves Lansdown can provide advise regarding which investments may be suitable through their team of financial advisors.