Households in Surrey Consume 24% More Energy than the Average in England
Households in Surrey are some of the biggest energy consumers in England. Higher income levels contribute to homes with larger energy needs; as a result we estimate that Surrey residents pay around £260 more in annual energy bills than residents of other counties in Great Britain.
We've analysed data from the Office of National Statistics (ONS) to see how energy use in Surrey compares to other counties and to identify the areas within Surrey that use the most and least amount of energy per household meter.
Surrey Ranks 2nd for Most Energy Used in England
Surrey households use 26% more gas and 19% more electricity than the average household in England. As a result, the average home in Surrey would pay around £260 more for energy (£137 for gas and £123 for electricity) than a home elsewhere in England. There is only one county with higher energy consumption per household than Surrey: Buckinghamshire, another South East county.
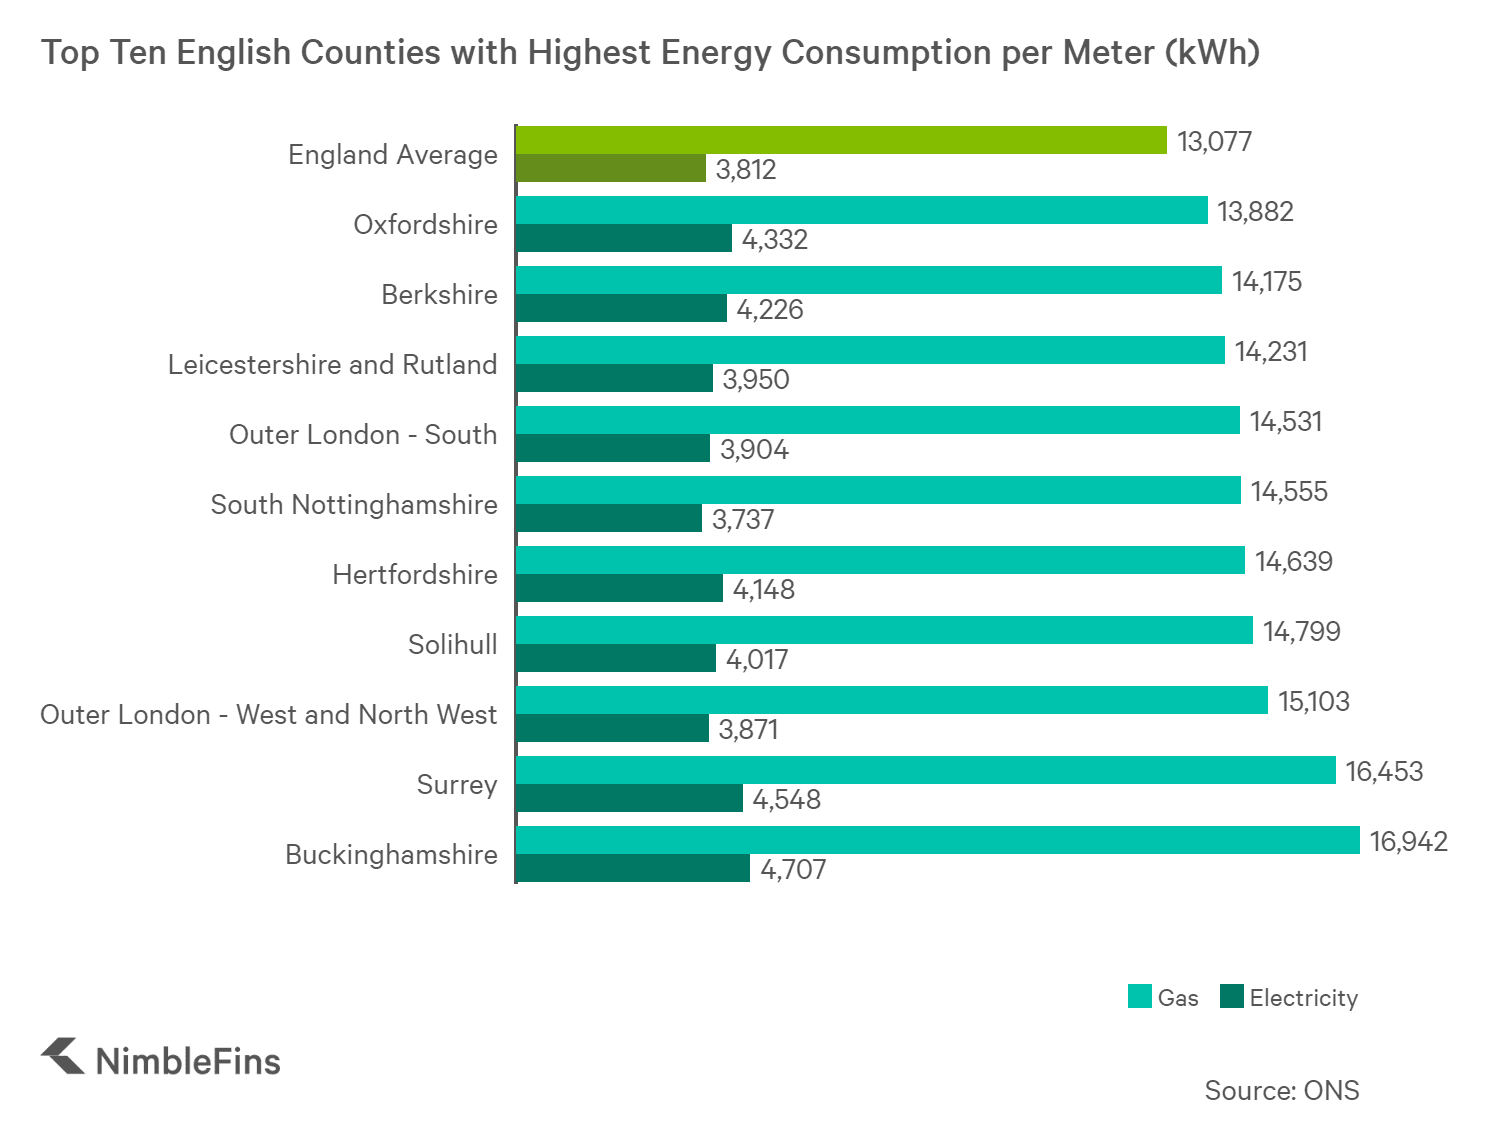
Top Ten English Counties with Highest Energy Consumption per Meter
| England Rank (1 = Highest Energy Consumption) | County | Gas (kWh) | Electricity (kWh) | Total (kWh) |
|---|---|---|---|---|
| 1 | Buckinghamshire | 16,942 | 4,707 | 21,649 |
| 2 | Surrey | 16,453 | 4,548 | 21,001 |
| 3 | Outer London - West and North West | 15,103 | 3,871 | 18,974 |
| 4 | Solihull | 14,799 | 4,017 | 18,815 |
| 5 | Hertfordshire | 14,639 | 4,148 | 18,787 |
| 6 | Outer London - South | 14,531 | 3,904 | 18,435 |
| 7 | Berkshire | 14,175 | 4,226 | 18,401 |
| 8 | South Nottinghamshire | 14,555 | 3,737 | 18,292 |
| 9 | Oxfordshire | 13,882 | 4,332 | 18,214 |
| 10 | Leicestershire CC and Rutland | 14,231 | 3,950 | 18,180 |
| England Average | 13,076 | 3,812 | 16,888 | |
Energy Consumption: Surrey vs. South East
When compared to other counties in the South East, Surrey still uses 20% more gas and 9% more electricity than average, which means homes in Surrey pay around £157 more for energy (£101 for gas and £56 for electricity) than those in neighboring South East counties each year.
As you can see in the table below, there is often a correlation between energy consumption and household income levels. This is to be expected, somewhat—generally speaking, those with higher incomes will live in larger homes that require more gas and electricity to run. At £28,010 per head of household per year, Surrey has the highest average Gross Domestic Household Income (GDHI) in the South East. (The GDHI is essentially the amount of money available for spending or saving after income distribution measures like taxes, social contributions and benefits have taken effect).
Average Domestic Energy Consumption per Meter: South East England
| SE Rank (1 = Highest Energy Consumption) | County | Gas (kWh) | Electricity (kWh) | GDHI per Head |
|---|---|---|---|---|
| 1 | Buckinghamshire | 16,942 | 4,707 | £26,829 |
| 2 | Surrey | 16,453 | 4,548 | £28,010 |
| 3 | Berkshire | 14,175 | 4,226 | £23,673 |
| 4 | Oxfordshire | 13,882 | 4,332 | £23,586 |
| 5 | Hampshire CC | 12,910 | 4,045 | £22,497 |
| 6 | Kent CC | 12,885 | 4,035 | £20,173 |
| 7 | West Sussex | 12,730 | 4,080 | £22,056 |
| 8 | East Sussex CC | 12,692 | 4,034 | £20,712 |
| 9 | Milton Keynes | 12,530 | 3,762 | £20,039 |
| 10 | Medway | 11,729 | 3,758 | £17,884 |
| 11 | Brighton and Hove | 11,719 | 3,471 | £20,508 |
| 12 | Isle of Wight | 11,025 | 3,735 | £16,781 |
| 13 | Southampton | 10,756 | 3,669 | £14,797 |
| 14 | Portsmouth | 10,392 | 3,432 | £15,066 |
| South East Average | 13,739 | 4,169 | £21,808 | |
| England Average | 13,076 | 3,812 | £19,447 | |
Who Uses the Most Energy in Surrey?
Elmbridge residents use more energy per home than any other local authority in Surrey, topping 18,000kWh of gas and 5,000kWh of electricity per year. At the opposite end of the spectrum, households in Spelthorne consume only 14,000kWh of gas and 4,000kWh of electricity annually. Despite being the local authority with the least energy consumption in Surrey, Spelthorne still uses more energy than average across the South East and England.

It's no surprise that Surrey households use more energy than average, since income levels are higher in this area of England. Slightly bucking the income-energy use correlation trend, Tandridge households have the lowest GDHI in Surrey yet rank 3rd highest in terms of energy consumption.
Average Domestic Energy Consumption per Meter: Surrey
| Surrey Rank (1 = Highest Energy Consumption) | Local Authority | Gas (kWh) | Electricity (kWh) | GDHI per Head |
|---|---|---|---|---|
| 1 | Elmbridge | 18,396 | 5,046 | £29,325 |
| 2 | Mole Valley | 17,372 | 4,819 | £27,469 |
| 3 | Tandridge | 17,278 | 4,832 | £26,830 |
| 4 | Waverley | 17,216 | 4,731 | £27,506 |
| 5 | Surrey Heath | 17,057 | 4,516 | £27,736 |
| 6 | Epsom and Ewell | 16,469 | 4,176 | £27,973 |
| 7 | Reigate and Banstead | 16,112 | 4,348 | £27,010 |
| 8 | Guildford | 15,844 | 4,501 | £29,223 |
| 9 | Woking | 15,742 | 4,478 | £28,064 |
| 10 | Runnymede | 15,419 | 4,537 | £28,987 |
| 11 | Spelthorne | 14,081 | 4,041 | £27,988 |
| Surrey Average | 16,453 | 4,548 | £28,010 | |
| South East Average | 13,740 | 4,169 | £21,808 | |
| England Average | 13,077 | 3,812 | £19,447 | |
Methodology
In order to see how Surrey compares to the rest of the England in terms of energy consumption, and to understand how energy use varies by local authority within Surrey, we gathered sub-national gas and electricity sales data from 2016, the most recent year available, from the Office of National Statistics (ONS). From there we found Mean Consumption per Meter (kWh) for each local authority in England, which we used to rank order the local authorities and counties. Also used in the research were GDHI and energy prices per kWh, also sourced from the ONS. Specifically, we used statistics of average energy costs of 3.7p/kWh for gas and 14.7p/kWh for electricity in the South East and 3.6p/kWh for gas and 14.4p/kWh across Great Britain.