Who Spends the Most Making a House a Home?
We've delved into data from the Office of National Statistics (ONS) to find out which age groups spend the most and least on various aspects of household spending, so you can see how your spending compares.
- How Much do UK Households Spend on Their Homes, by Category?
- How Much do UK Households Spend on Their Homes, by Age?
- How Much do UK Households Spend on Their Homes, by Age and Category?
Average UK Spending on Household Goods & Services, by Category
Of the £2,116 spent by UK households each year on their homes, nearly half goes towards big-ticket items like furniture and furnishings, representing nearly 8% of the average UK household budget. After furniture and furnishings, we tend to put the most money towards routine household maintenance to keep our homes running well and appliances like washing machines, toasters and hoovers.
| Average Annual UK Spending on Household Goods & Services | |
|---|---|
| Furniture and furnishings | £978 |
| Routine household maintenance | £348 |
| Household appliances | £224 |
| Floor Coverings | £198 |
| Tools and equipment for house and garden | £151 |
| Household textiles | £114 |
| Glassware, tableware and household utensils | £99 |
| Average Annual Spend | £2,116 |

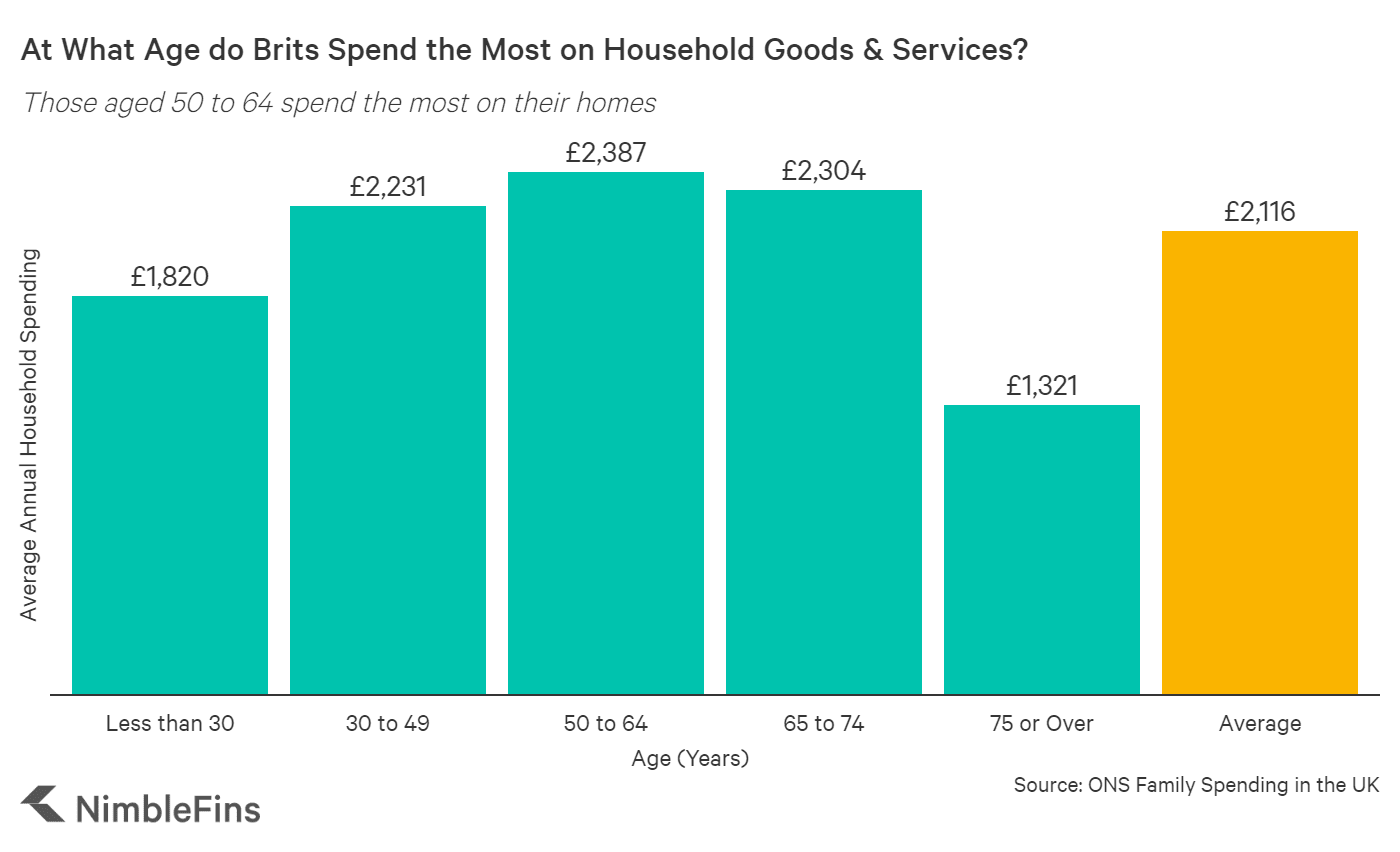
Average UK Spending on Household Goods & Services, by Age
Households aged 50 to 64 years old spend more than any other age group on household goods & services, spending £2,387 per year (13% more than average) on furniture, textiles, appliances, etc. The youngest and oldest among us spend the least, with under 30s parting with £1,820 and the over 75s spending £1,321 each year on their homes.
| Average Annual UK Spending on Household Goods & Services, by age | |
|---|---|
| Less than 30 | £1,820 |
| 30 to 49 | £2,231 |
| 50 to 64 | £2,387 |
| 65 to 74 | £2,304 |
| 75 or Over | £1,321 |
| Average Annual Spend | £2,116 |
Breaking Down the Data
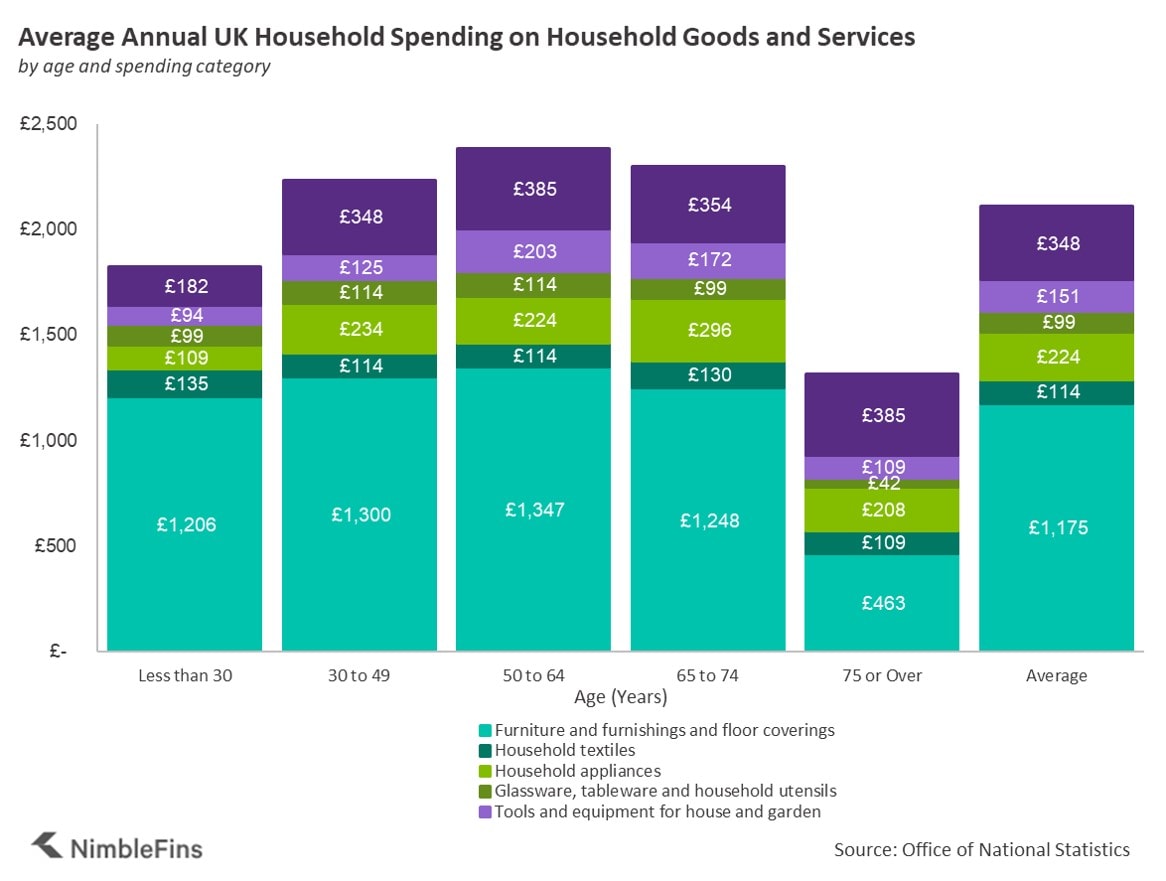
Depending on their stage of life, people tend to spend more or less on specific areas of their homes such as furniture, textiles, appliances, etc. To see how these spending patterns change with age, we've used the data to see which age group spends the least and the most by subcategory. For instance, the under 30s spend more on textiles than other age groups, whereas the 50 to 64 year olds spend more on furniture and glassware than other ages.
| Which Age Group Spends... | the Least? | the Most? |
|---|---|---|
| Household textiles | Over 75 | Under 30 |
| Glassware, tableware and household utensils | Over 75 | 30 to 49 & 50 to 64 |
| Furniture, furnishings and floor coverings | Over 75 | 50 to 64 |
| Household appliances | Under 30 | 65 to 75 |
| Tools and equipment for house and garden | Under 30 | 50 to 64 |
| Routine household maintenance | Under 30 | Over 75 |
Specifically, we can see the average annual household spending for each subcategory by age group in the following table and chart.
| How UK Households Spend on Their Homes | Under 30 | 30 to 49 | 50 to 64 | 65 to 74 | Over 75 | Average |
|---|---|---|---|---|---|---|
| Furniture and furnishings | £1,076 | £1,118 | £1,076 | £1,009 | £359 | £978 |
| Goods and services for routine household | £182 | £348 | £385 | £354 | £385 | £348 |
| Household textiles | £135 | £114 | £114 | £130 | £109 | £114 |
| Floor coverings | £130 | £182 | £265 | £234 | £104 | £198 |
| Household appliances | £109 | £234 | £224 | £296 | £208 | £224 |
| Glassware, tableware and household utensils | £99 | £114 | £114 | £99 | £42 | £99 |
| Tools and equipment for house and garden | £94 | £125 | £203 | £172 | £109 | £151 |
| Average Annual Spending | £1,820 | £2,230 | £2,387 | £2,304 | 1321 | £2,116 |
For those interested in the finer details, we broke down the data even further to see average spending by age group for each category.
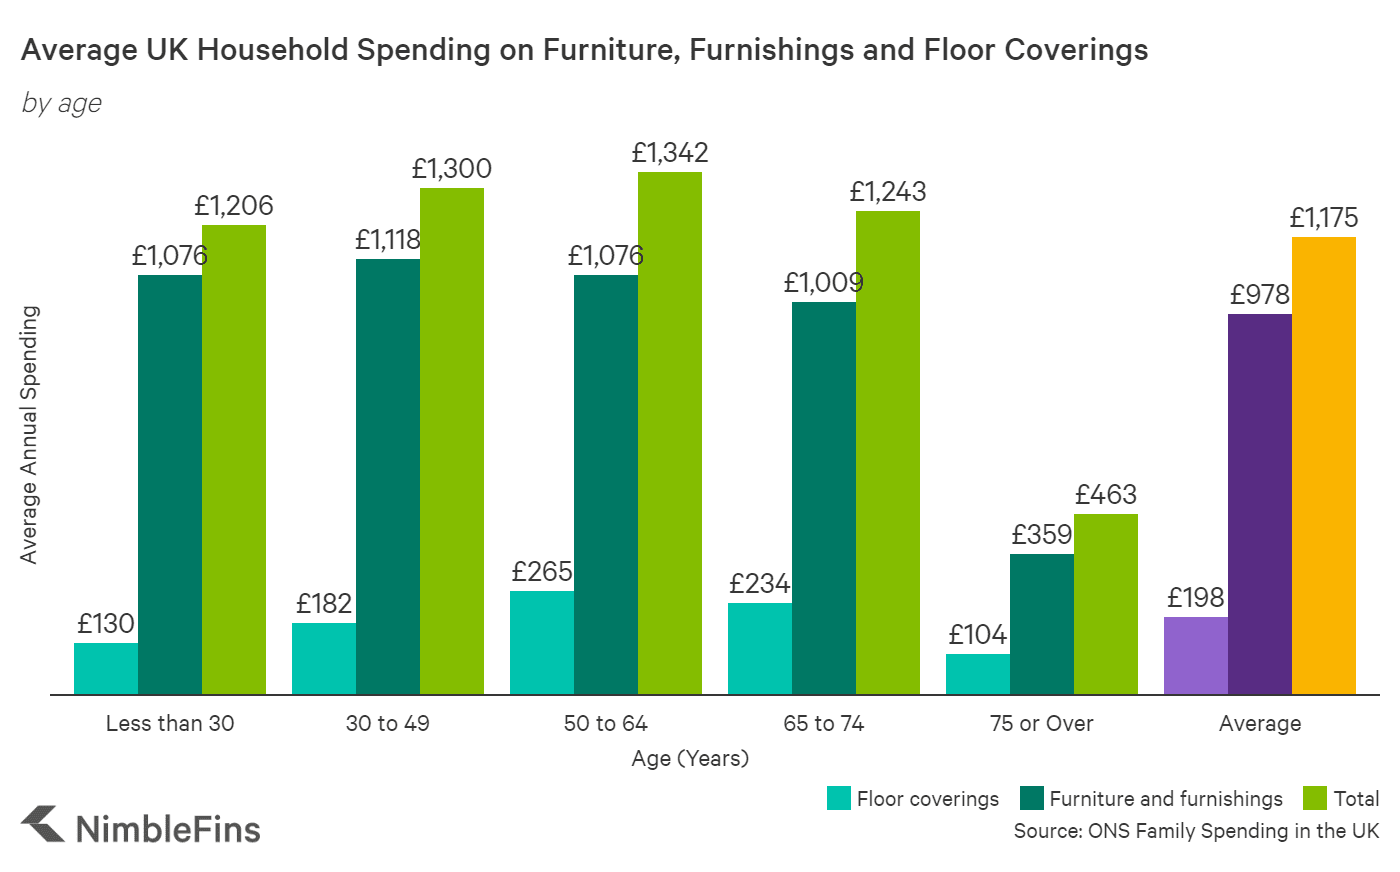
Furniture, Furnishings and Floor Coverings
Across the board, people allocate more money to furniture, furnishings and floor coverings than to any other area of home goods or services. The age bracket spending the most on furniture and furnishings for their homes is 30 and 49, who spend £1,118 per household each year. The next age bracket, those aged 50 to 64, spends more on floor coverings (e.g., rugs) than any other age group. In fact, this 50 to 64 age bracket spends more on furniture, furnishings and floor coverings overall, totaling £1,342 of spending per year. The over 75s spend the least on this category.
| Average UK Household Spending on Furniture, Furnishings and Floor Coverings, by age | Floor coverings | Furniture and furnishings | Total |
|---|---|---|---|
| Less than 30 | £130 | £1,076 | £1,206 |
| 30 to 49 | £182 | £1,118 | £1,300 |
| 50 to 64 | £265 | £1,076 | £1,342 |
| 65 to 74 | £234 | £1,009 | £1,243 |
| 75 or Over | £104 | £359 | £463 |
| Average | £198 | £978 | £1,175 |
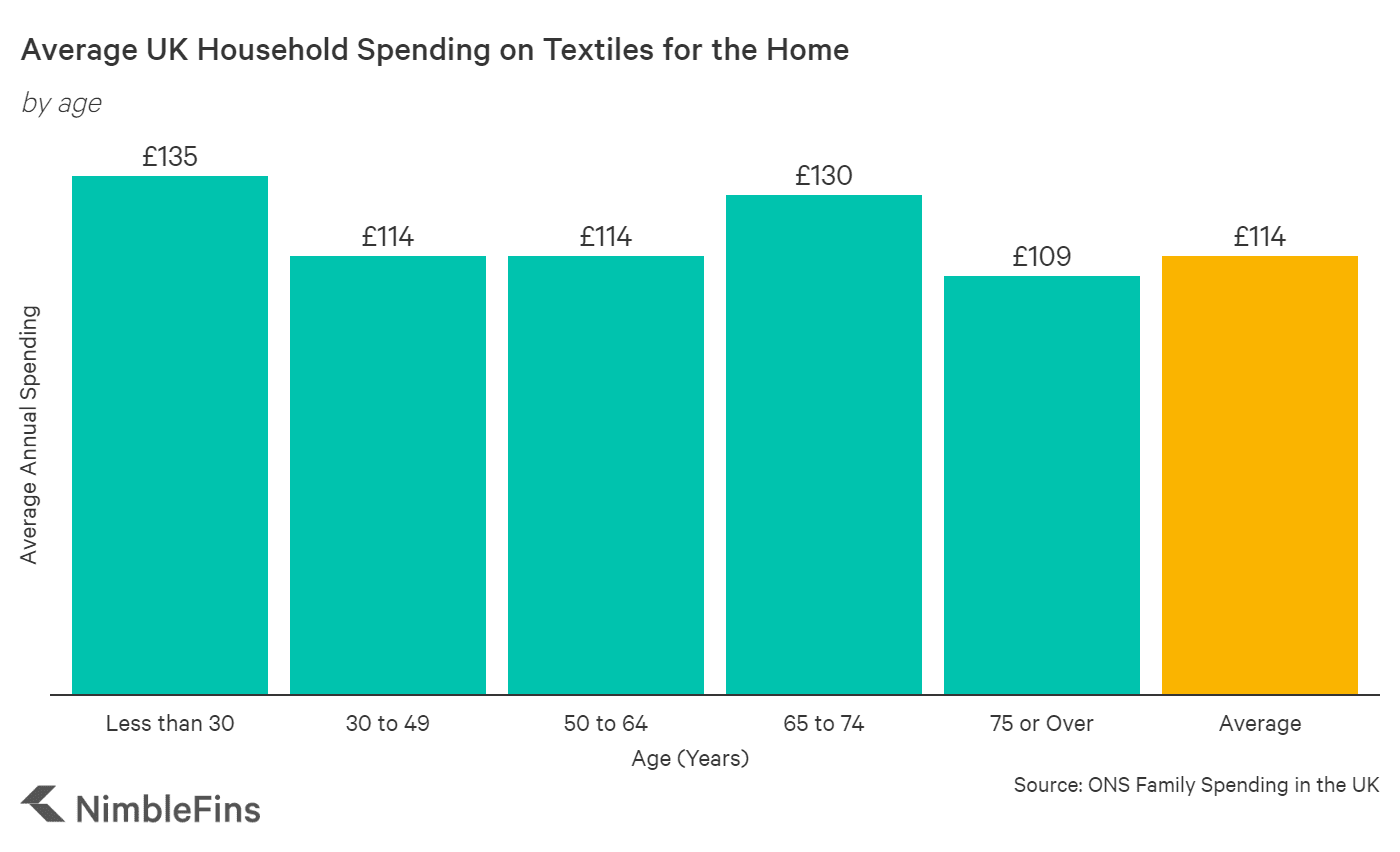
Household Textiles
In terms of textiles, the under 30s are the highest-spending age bracket. This age group spends £135 per year per household, which is 18% more than average. Interestingly, spending pops up again for those in the 65 to 74 age bracket before dipping down again. On average, however, UK households spend £114 per year on household textiles.
| Average UK Household Spending on Textiles for the Home, by age | |
|---|---|
| Less than 30 | £135 |
| 30 to 49 | £114 |
| 50 to 64 | £114 |
| 65 to 74 | £130 |
| 75 or Over | £109 |
| Average | £114 |
Household Appliances
On average, UK households spend £224 per year on household appliances. Households with a primary age of 65 to 74 years old spend more than any other age group on these devices, parting with £296 per year on average for toasters, washing machines, hoovers, etc. The age group spending the least on this category is the under 30s, who spend £109 each year on home appliances.
| Average UK Household Spending on Household Appliances, by age | |
|---|---|
| Less than 30 | £109 |
| 30 to 49 | £234 |
| 50 to 64 | £224 |
| 65 to 74 | £296 |
| 75 or Over | £208 |
| Average | £224 |

Glassware, Tableware and Household Utensils
UK households spend £99 per year on average for glassware, tableware and household utensils. Households with a primary age of 30 to 64 years old spend £114 on these items, 15% more than average across all age groups. The over 75s spend just £42 per year on glassware, tableware and utensils.
| Average UK Household Spending on Glassware, Tableware and Household Utensils, by age | |
|---|---|
| Less than 30 | £99 |
| 30 to 49 | £114 |
| 50 to 64 | £114 |
| 65 to 74 | £99 |
| 75 or Over | £42 |
| Average | £99 |

Tools and Equipment for House and Garden
Once again, those in the 50 to 64 age bracket are the biggest spenders in the tools and equipment category, forking out over £200 per year on average, around 34% more than average. The Under 30 group spends less than £100 on tools and equipment for house and garden.
| Average UK Household Spending on Tools and Equipment for House and Garden, by age | |
|---|---|
| Less than 30 | £94 |
| 30 to 49 | £125 |
| 50 to 64 | £203 |
| 65 to 74 | £172 |
| 75 or Over | £109 |
| Average | £151 |

Goods and Services for Routine Household Maintenance
The average UK household spends £354 per year on goods and services for routine household maintenance. It is not a surprise that those aged 75 and older spend more than other age groups on this category, primarily due to increased spending on domestic services to assist them around the home.
| Average UK Household Spending on Routine Household Maintenance, by age | Domestic services, carpet cleaning, etc. | Household goods and hardware | Cleaning materials | Total |
|---|---|---|---|---|
| Less than 30 | £10 | £78 | £99 | £187 |
| 30 to 49 | £130 | £94 | £130 | £354 |
| 50 to 64 | £146 | £104 | £135 | £385 |
| 65 to 74 | £125 | £88 | £135 | £348 |
| 75 or Over | £239 | £57 | £88 | £385 |
| Average | £140 | £88 | £125 | £354 |

Regardless of how much you spend on your home, be sure to invest in a suitable insurance policy. If you're not sure where to begin, take a look at our article on good, cheap home insurance companies—even if you're renting.