The guidance on this site is based on our own analysis and is meant to help you identify options and narrow down your choices. We do not advise or tell you which product to buy; undertake your own due diligence before entering into any agreement. Read our full disclosure here.
Average Driving Test Pass Rates
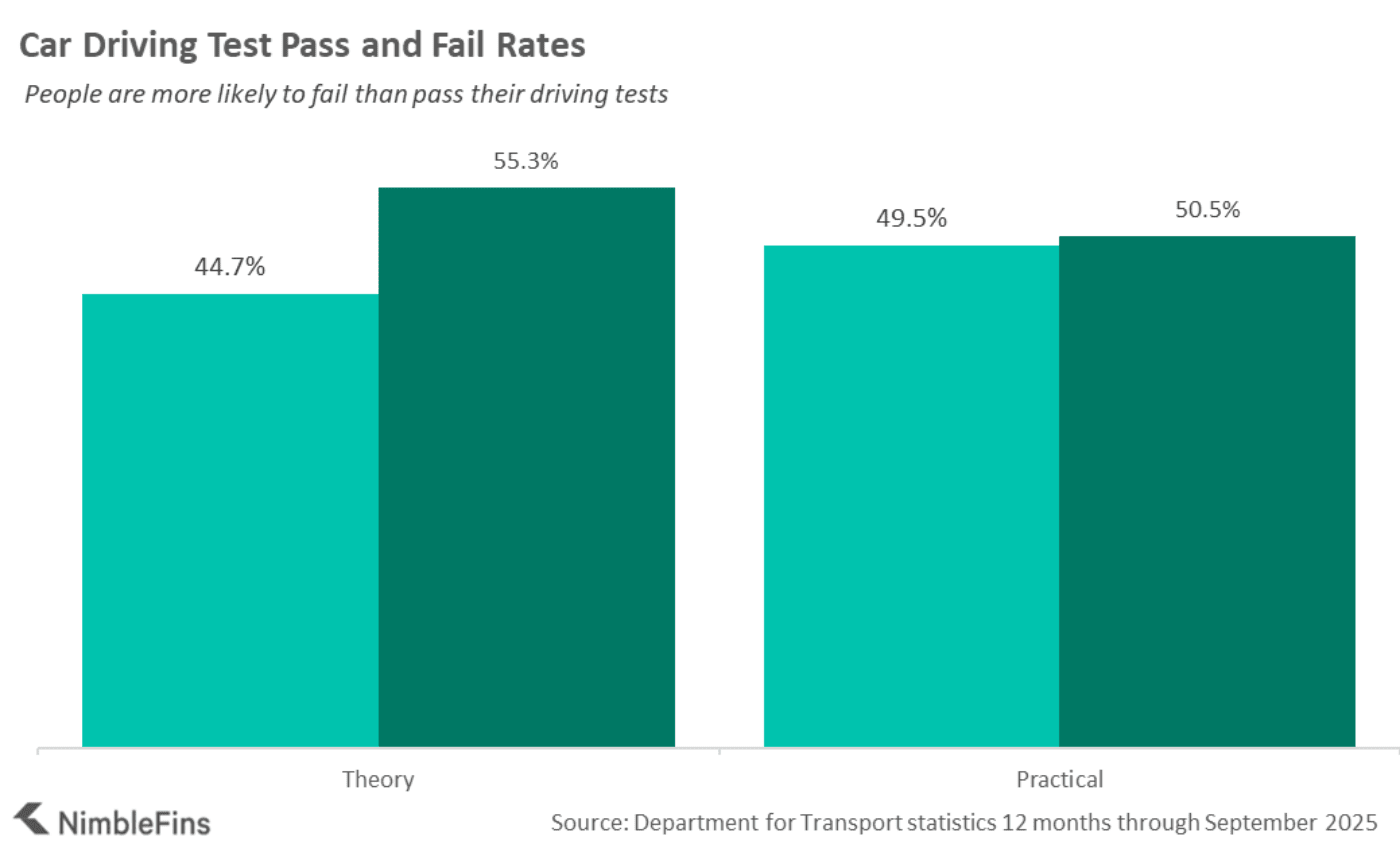
As of March 2026, the latest Department for Transport data showed that only 49.5% of practical driving tests ended in a pass; and 44.7% of theory tests ended in a pass. This means that driving test takers are more likely to fail a test than pass it. However, the pass rates change by gender and age. Read below to find driving test pass rate statistics for your demographic. This information can be useful when researching driving lessons and instructors, to see how their pass rate compares to the UK average.
How Many People Pass the Car Driving Test?
In March 2026, the latest data showed that in Great Britain, of the 1,856,172 people who took the practical driving test, only 919,151 passed—a pass rate of just 49.5% for the practical driving test. That means that less than half of people pass the test when they take it. However, the pass rates are different the first time you take the test than on subsequent goes.
For the theory test, around 44.7% of test takers passed the theory test in 2024/25.
| Car Test Pass Rates | Pass | Fail |
|---|---|---|
| Theory | 44.7% | 55.3% |
| Practical | 49.5% | 50.5% |
How Many People Pass the Practical Driving Test for Cars the First Time?
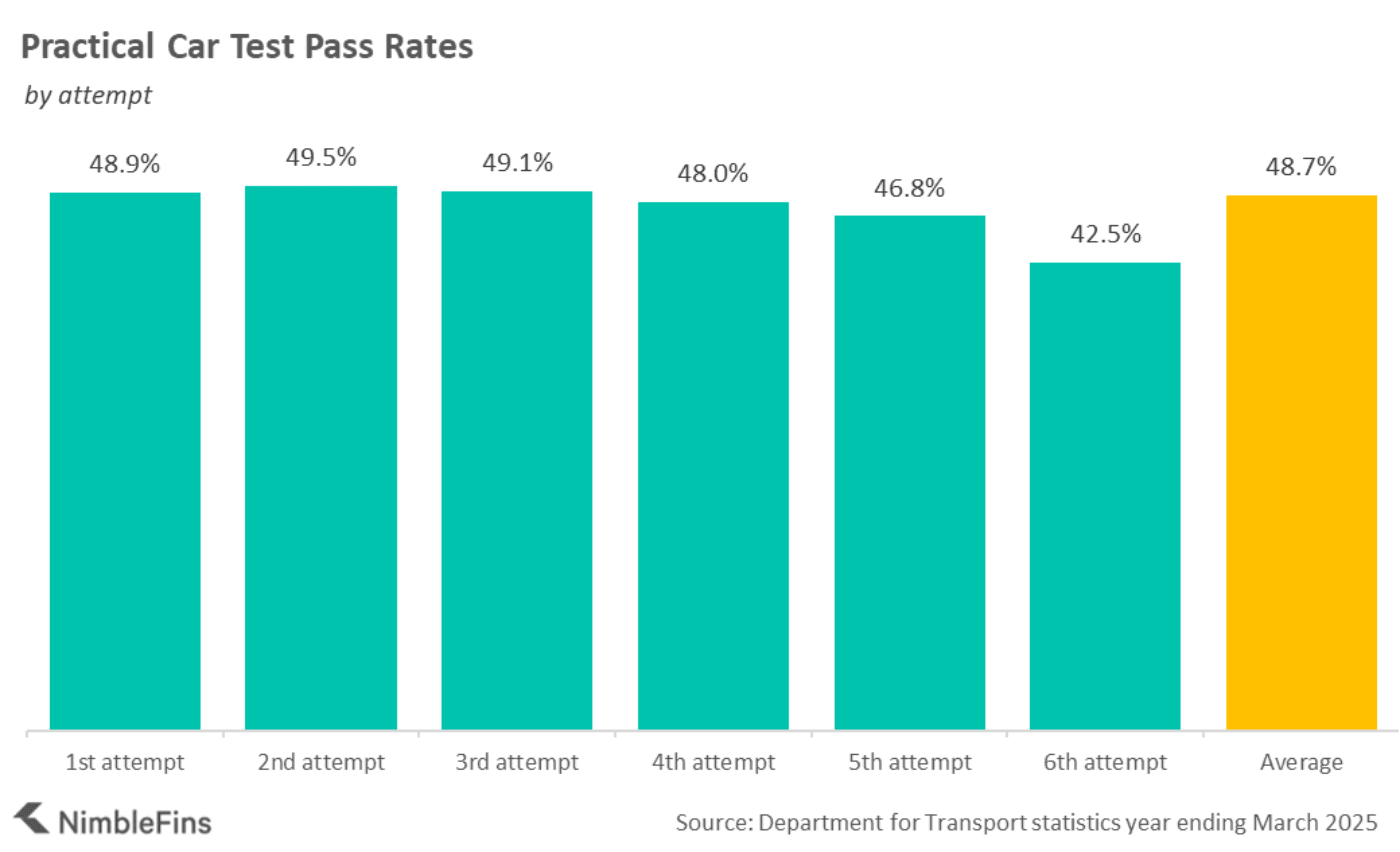
For 2026, the latest practical driving test pass rates show that 48.9% of test takers pass on the first attempt. The pass rate improves very slightly for those taking the test the second time, with 49.5% passing on the second attempt. However, if you haven't passed after two attempts it seems to steadily become harder to qualify to drive, as the pass rate drops steadily between 3 and 6 attempts. By the 6th attempt, only 42.5% of test takers pass their test.
| Practical Car Test Pass Rates | Conducted | Passed | Pass Rate (%) |
|---|---|---|---|
| 1st attempt | 900,260 | 440,408 | 48.9% |
| 2nd attempt | 452,154 | 223,855 | 49.5% |
| 3rd attempt | 227,232 | 111,480 | 49.1% |
| 4th attempt | 116,590 | 55,962 | 48.0% |
| 5th attempt | 61,806 | 28,902 | 46.8% |
| 6th attempt | 81,775 | 34,761 | 42.5% |
| Total | 1,839,817 | 895,368 | 48.7% |
How Many Men and Women Pass the Driving Test?
Driving pass rates differ slightly by gender. Men have a slightly higher pass rate than women on the practical test (50.2% vs. 48.6%, respectively) but, whatever your gender, in 2026 there's roughly a one in two chance of passing the practical driving test.
| Practical Driving Test Pass Rates | Conducted | Passed | Percent |
|---|---|---|---|
| Men | 1,035,509 | 520,335 | 50.2% |
| Women | 820,654 | 398,811 | 48.6% |
| Average | 1,856,172 | 919,151 | 49.5% |

However, women have better pass rates then men when it comes to the theory test. In 2024/25 women passed at a rate of 47.1% while 42.9% of men passed the theory test when they took it.
| How Many People Pass the Practical Driving Test? | Conducted | Passed | Percent |
|---|---|---|---|
| Men | 1,626,857 | 697,913 | 42.9% |
| Women | 1,283,591 | 604,060 | 47.1% |
| Average | 2,910,455 | 1,301,978 | 44.7% |

Driving Test Pass Rates by Age
For the practical test, those aged 17 and under have the best driving test pass rates, with 60% of practical driving tests at the age ending in a pass. The rate drops to 52.7% for 18 year olds and generally declines from there. Those 50 and older typically have pass rates in the range of 36%-37%.
In terms of the theory test, those aged 17 and under have the best theory test pass rates, with 50% of this age group passing. By age 18, the pass rate drops to 39.7%, but then the rate pops back up for those slightly older, with 21 and 22 year olds achieving 48% pass rates. Those aged 45 and above have the worst pass rates, with under 38-39%% of tests ending in a pass.
| Number Taking and Passing the Driving Test by Age | Practical | Theory | ||||
|---|---|---|---|---|---|---|
| Conducted | Passes | Pass Rate (%) | Conducted | Passes | Pass Rate (%) | |
| 17 and under | 300,851 | 182,079 | 60.5% | 646,655 | 323,124 | 50.0% |
| 18 | 215,485 | 113,534 | 52.7% | 243,631 | 96,630 | 39.7% |
| 19 | 128,219 | 64,536 | 50.3% | 158,349 | 66,804 | 42.2% |
| 20 | 96,410 | 47,947 | 49.7% | 125,673 | 56,815 | 45.2% |
| 21 | 81,571 | 41,256 | 50.6% | 114,207 | 54,953 | 48.1% |
| 22 | 72,817 | 36,583 | 50.2% | 100,682 | 48,323 | 48.0% |
| 23 | 64,569 | 32,121 | 49.7% | 93,547 | 43,601 | 46.6% |
| 24 | 59,848 | 29,039 | 48.5% | 90,976 | 41,462 | 45.6% |
| 25 | 57,288 | 27,471 | 48.0% | 89,115 | 40,062 | 45.0% |
| 26 | 56,401 | 26,465 | 46.9% | 87,265 | 39,038 | 44.7% |
| 27 | 55,159 | 25,413 | 46.1% | 85,871 | 37,874 | 44.1% |
| 28 | 52,380 | 23,799 | 45.4% | 81,486 | 35,604 | 43.7% |
| 29 | 50,395 | 22,557 | 44.8% | 77,785 | 33,817 | 43.5% |
| 30 | 47,832 | 21,286 | 44.5% | 71,881 | 31,369 | 43.6% |
| 31 | 45,838 | 20,208 | 44.1% | 67,936 | 29,726 | 43.8% |
| 32 | 43,603 | 19,000 | 43.6% | 62,912 | 27,483 | 43.7% |
| 33 | 40,683 | 17,689 | 43.5% | 56,988 | 25,228 | 44.3% |
| 34 | 39,307 | 16,680 | 42.4% | 55,711 | 24,263 | 43.6% |
| 35 | 37,022 | 15,439 | 41.7% | 51,766 | 22,204 | 42.9% |
| 36 | 34,407 | 14,211 | 41.3% | 47,481 | 20,221 | 42.6% |
| 37 | 31,935 | 13,071 | 40.9% | 43,985 | 18,509 | 42.1% |
| 38 | 29,787 | 11,844 | 39.8% | 40,848 | 17,389 | 42.6% |
| 39 | 27,380 | 10,899 | 39.8% | 37,183 | 15,671 | 42.1% |
| 40 | 24,315 | 9,659 | 39.7% | 33,343 | 13,892 | 41.7% |
| 41 | 22,264 | 8,647 | 38.8% | 30,816 | 12,411 | 40.3% |
| 42 | 19,124 | 7,674 | 40.1% | 26,883 | 10,943 | 40.7% |
| 43 | 17,021 | 6,528 | 38.4% | 23,702 | 9,605 | 40.5% |
| 44 | 15,228 | 5,794 | 38.0% | 21,848 | 8,681 | 39.7% |
| 45 | 13,157 | 4,890 | 37.2% | 18,284 | 7,330 | 40.1% |
| 46 | 11,042 | 4,052 | 36.7% | 15,802 | 6,032 | 38.2% |
| 47 | 9,100 | 3,378 | 37.1% | 12,938 | 4,949 | 38.3% |
| 48 | 8,102 | 2,995 | 37.0% | 11,616 | 4,381 | 37.7% |
| 49 | 6,964 | 2,569 | 36.9% | 10,248 | 3,940 | 38.4% |
| 50 to 59 | 30,294 | 11,163 | 36.8% | 47,425 | 17,812 | 37.6% |
| 60 and over | 5,384 | 1,957 | 36.3% | 8,001 | 3,123 | 39.0% |
