Where Households Spent More in 2017
How did UK household spending patterns change in 2017? We've analyzed recently published 2017 family spending data from the Office of National Statistics (ONS) to understand trends in British spending patterns and how they've changed since 2016. Spending on Education fell nearly 20%; spending on Household Goods, Restaurants & Hotels and Education rose around 10% in 2017.
For a detailed analysis of 2017 spending, please see our articles on the Average UK Household Budget and the Average UK Cost of Food.
Categories with the Largest Rises in Spending
Three categories stood out in particular for large increases in household spending from 2016 to 2017. On average, households spent around 10% more on restaurants & hotels, household goods & services and transport in 2017 than they did in 2016.

The category of household good & services includes expenditures like furniture, furnishings, textiles, appliances, tools, cleaning products and services, etc.
| Annual Spend Breakdown: Household Goods | 2016 | 2017 | Change |
|---|---|---|---|
| Furniture and furnishings, carpets and other floor coverings | £1,102 | £1,139 | 3% |
| Household textiles | £99 | £104 | 5% |
| Household appliances | £125 | £177 | 42% |
| Glassware, tableware and household utensils | £94 | £99 | 6% |
| Tools and equipment for house and garden | £114 | £172 | 50% |
| Goods and services for routine household maintenance | £317 | £354 | 11% |
| Overall | 10.7% |
In the restaurant and hotel spending category, UK households on average spent 44% more on holidays abroad—likely due in part to a weaker pound.
| Annual Spend Breakdown: Restaurants & Hotels | 2016 | 2017 | Change |
|---|---|---|---|
| Restaurant and café meals | £900 | £988 | 10% |
| Alcoholic drinks (away from home) | £390 | £411 | 5% |
| Take away meals eaten at home | £244 | £265 | 9% |
| Other take-away and snack food | £229 | £260 | 14% |
| Contract catering (food) | £36 | £26 | -29% |
| Canteens | £88 | £88 | 0% |
| Holiday in the UK | £265 | £281 | 6% |
| Holiday abroad | £187 | £270 | 44% |
| Room hire | £10 | £21 | 100% |
| Overall | 11.1% |
Changes in transport spending largely came from a 21% rise in spending on new and used vehicles, with the exception of motorcycles which saw a 46% drop in expenditures.
| Annual Spend Breakdown: Transport | 2016 | 2017 | Change |
|---|---|---|---|
| Purchase of new cars and vans | £452 | £546 | 21% |
| Purchase of second hand cars or vans | £775 | £936 | 21% |
| Purchase of motorcycles | £68 | £36 | -46% |
| Motoring Costs (e.g., repairs, servicing, garaging, etc.) | £593 | £598 | 1% |
| Petrol, diesel and motor oil | £1,009 | £1,076 | 7% |
| Rail, tube, bus and coach fares | £317 | £307 | -3% |
| Other fares (e.g., air, car leasing) | £572 | £640 | 12% |
| Overall | 9.6% |
Categories with the Largest Drops in Spending
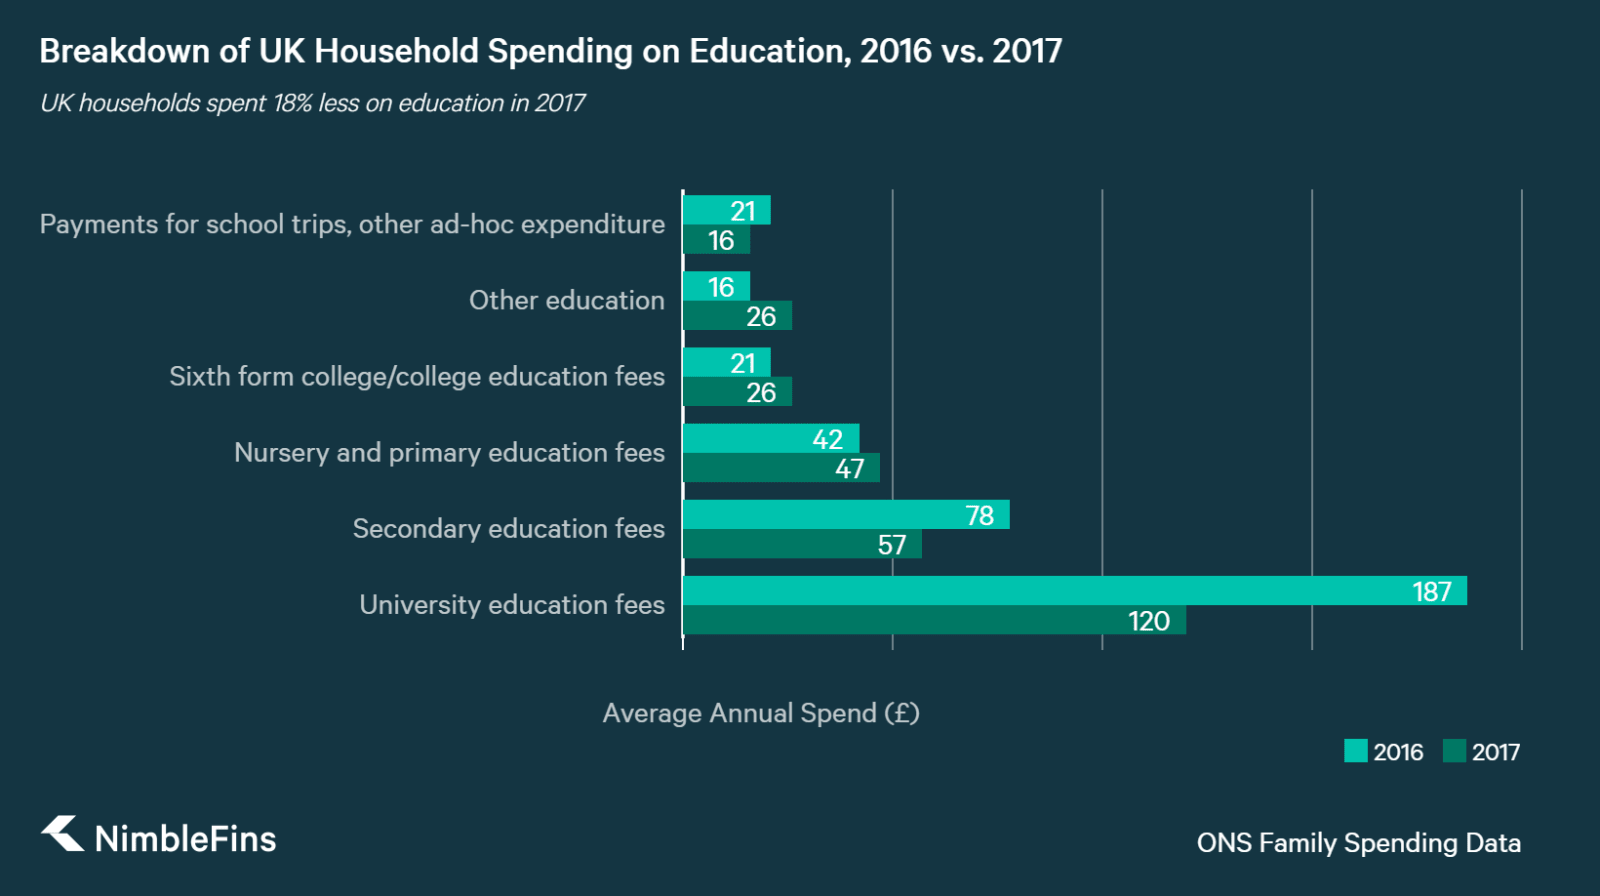
What is the only major category in which Brits spent less in 2017? Education. The average UK household spent £296 on education in 2017 compared with £364 in 2016. That's a drop of nearly 20% year on year. Breaking down the data further, we found that households allocated 27% less to secondary education fees, 36% less to university fees and 25% less to other related expenses like school trips.
| Annual Spend Breakdown: Education | 2016 | 2017 | % Change |
|---|---|---|---|
| Payments for school trips, other ad-hoc expenditure | £21 | £16 | -25% |
| Other education | £16 | £26 | 67% |
| Sixth form college/college education fees | £21 | £26 | 25% |
| Nursery and primary education fees | £42 | £47 | 13% |
| Secondary education fees | £78 | £57 | -27% |
| University education fees | £187 | £120 | -36% |
Breakdown of Household Spending Changes 2016 to 2017
To see how each major spending category has changed from 2016 to 2017, please see the table below.
| 2016 | 2017 | % Change | |
|---|---|---|---|
| Education | £364 | £296 | -18.6% |
| Other expenditure items | £3,827 | £3,744 | -2.2% |
| Housing(net)2, fuel and power | £3,770 | £3,775 | 0.1% |
| Health | £374 | £380 | 1.4% |
| Food and non-alcoholic drinks | £2,954 | £3,016 | 2.1% |
| Alcoholic drink, tobacco and narcotics | £593 | £619 | 4.4% |
| Miscellaneous goods and services | £2,064 | £2,174 | 5.3% |
| Clothing and footwear | £1,222 | £1,305 | 6.8% |
| Communication | £832 | £894 | 7.5% |
| Recreation and culture | £3,536 | £3,822 | 8.1% |
| Transport | £3,780 | £4,144 | 9.6% |
| Household goods and services | £1,846 | £2,044 | 10.7% |
| Restaurants and hotels | £2,345 | £2,605 | 11.1% |
Please note there may be slight variations in values when looking at in-depth breakdowns vs. overall numbers due to rounding differences.