Labour Stats: How much we work, and how much we earn
Two key pieces of information most of us care about when it comes to our jobs. How much will we earn? And how many hours will we work? And... how does this compare to other people? Here, we've carved out stats related to these two key areas of interest for UK workers. See the trends and how you compare.
Average UK earnings
The average amount earned per week was £741 in November 2025, an increase of 4.8% from a year earlier.
Most recently, in November 2025, private sector employees earn £744 per week (seasonally adjusted total pay), while public sector staff earn an average of £730.
Unsurprisingly, the highest-paying sector is 'Finance and business services', where people earn an average of £987 weekly (£51,306 annually). Compare this to 'Wholesaling, retailing, hotels & restaurants', where people earn half as much, or £495 a week (£25,718 a year).
We all know that inflation is taking a bite out of our finances. Has pay kept up? Let's take a look at the pay trends from the past 10 years to see what's happening.
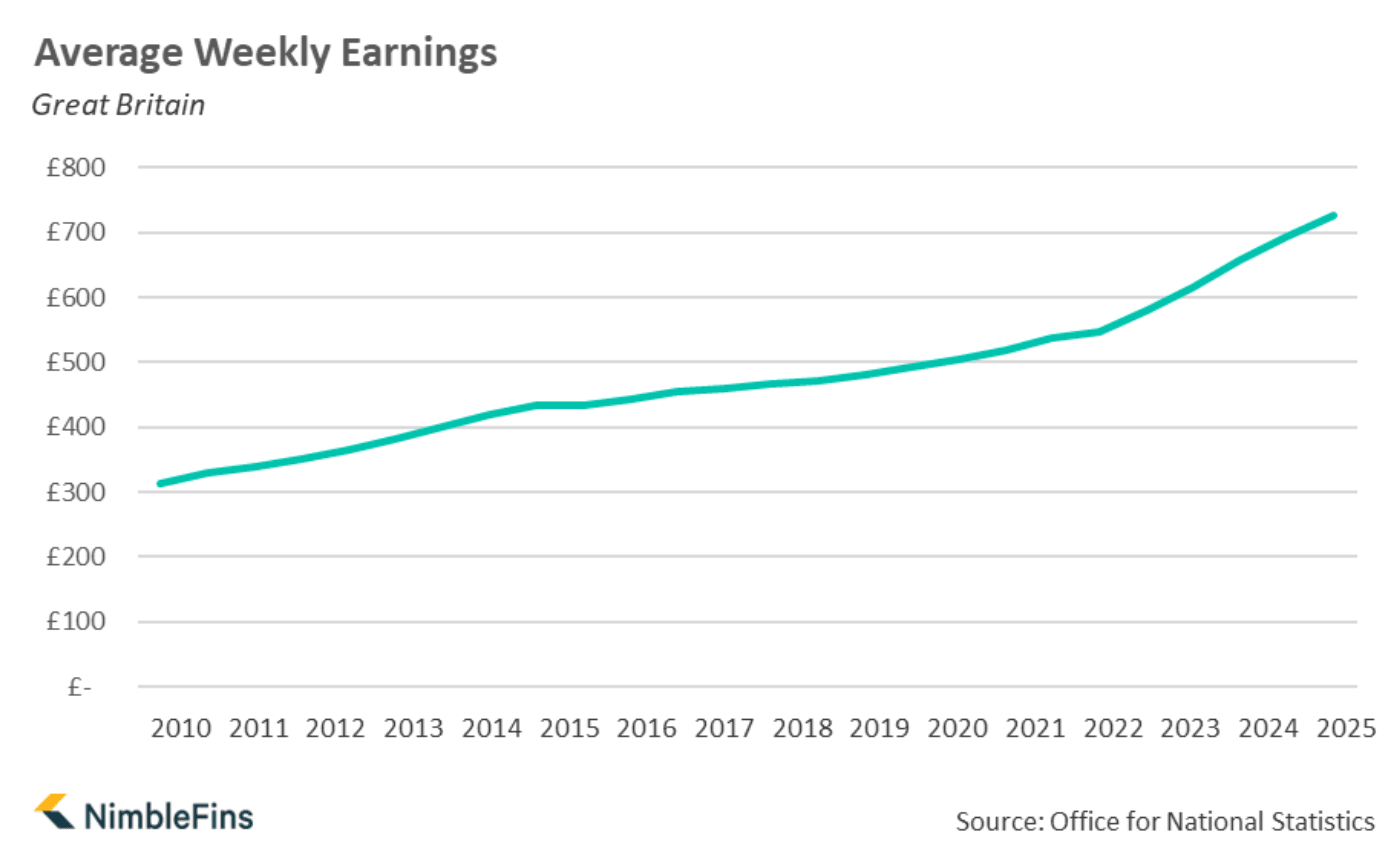
On an annual basis, we're earning around 51% or £12,750 more a year now (£37,812 in 2025 vs £25,063 in 2015).
So the good news it, yes, we are earning more now—about 50% more than we earned 10 years ago. But is this enough? How does it compare to inflation? Due to inflation (specifically, using the RPI All Items Index), the price of things has increased by 56% over the same time period (the past 10 years). Hrrmmm. It's no surprise we're feeling the pinch. Wages haven't risen as much as our living costs.
Here's annualised weekly wage data going back 25 years, if you'd like to look at the details:
| Average pay | Weekly | Annualised |
|---|---|---|
| 2000 | £313 | £16,256 |
| 2001 | £329 | £17,093 |
| 2002 | £339 | £17,643 |
| 2003 | £350 | £18,209 |
| 2004 | £365 | £19,000 |
| 2005 | £382 | £19,878 |
| 2006 | £400 | £20,808 |
| 2007 | £420 | £21,824 |
| 2008 | £435 | £22,595 |
| 2009 | £434 | £22,576 |
| 2010 | £444 | £23,097 |
| 2011 | £455 | £23,644 |
| 2012 | £461 | £23,952 |
| 2013 | £466 | £24,216 |
| 2014 | £471 | £24,478 |
| 2015 | £482 | £25,063 |
| 2016 | £494 | £25,664 |
| 2017 | £505 | £26,264 |
| 2018 | £520 | £27,031 |
| 2019 | £538 | £27,957 |
| 2020 | £547 | £28,460 |
| 2021 | £580 | £30,155 |
| 2022 | £616 | £32,014 |
| 2023 | £659 | £34,271 |
| 2024 | £694 | £36,099 |
| 2025 | £727 | £37,812 |
Average hours worked
So if we're earning less, are we working less?
Mostly.
On average across all workers, we're clocking 31.8 hours of work a week now (Sep - Nov 2025). This is 24 minutes less a week (1.2% less) compared to 10 years ago.
It's full time workers that are really dragging this figure down—they're working 36.6 hours a week now, down ~1 hour from 10 years ago (2.5% less).
But people are clocking more hours in part-time work. Specifically, just under 15 minutes more each week for part-time work.

So, we're working a touch less overall than we were 10 years ago, but people's pay has dropped more than you'd expect for the decrease in hours worked (when you take inflation into account)...
Here's the detailed data for hours worked in Great Britain going back 10 years:
| Average hours worked per week, Great Britain | All workers | Full-time workers | Part-time workers | Second Jobs |
|---|---|---|---|---|
| Sep-Nov 2015 | 32.2 | 37.6 | 16.3 | 9.4 |
| Oct-Dec 2015 | 32.3 | 37.7 | 16.3 | 9.6 |
| Nov-Jan 2016 | 32.2 | 37.6 | 16.3 | 9.4 |
| Dec-Feb 2016 | 32.1 | 37.5 | 16.2 | 9.5 |
| Jan-Mar 2016 | 32.1 | 37.6 | 16.1 | 9.4 |
| Feb-Apr 2016 | 32.1 | 37.6 | 16.1 | 9.5 |
| Mar-May 2016 | 32.1 | 37.5 | 16.1 | 9.6 |
| Apr-Jun 2016 | 32.0 | 37.4 | 16.1 | 9.6 |
| May-Jul 2016 | 32.0 | 37.4 | 16.1 | 9.6 |
| Jun-Aug 2016 | 31.9 | 37.3 | 16.1 | 9.7 |
| Jul-Sep 2016 | 32.0 | 37.4 | 16.2 | 9.6 |
| Aug-Oct 2016 | 31.9 | 37.2 | 16.1 | 9.7 |
| Sep-Nov 2016 | 32.0 | 37.4 | 16.2 | 9.6 |
| Oct-Dec 2016 | 32.1 | 37.5 | 16.2 | 9.7 |
| Nov-Jan 2017 | 32.2 | 37.6 | 16.3 | 9.7 |
| Dec-Feb 2017 | 32.3 | 37.6 | 16.4 | 9.8 |
| Jan-Mar 2017 | 32.2 | 37.5 | 16.3 | 9.7 |
| Feb-Apr 2017 | 32.2 | 37.6 | 16.2 | 9.5 |
| Mar-May 2017 | 32.2 | 37.5 | 16.2 | 9.3 |
| Apr-Jun 2017 | 32.3 | 37.6 | 16.3 | 9.3 |
| May-Jul 2017 | 32.2 | 37.5 | 16.3 | 9.3 |
| Jun-Aug 2017 | 32.1 | 37.4 | 16.3 | 9.5 |
| Jul-Sep 2017 | 32.0 | 37.3 | 16.2 | 9.8 |
| Aug-Oct 2017 | 31.9 | 37.2 | 16.1 | 10.0 |
| Sep-Nov 2017 | 31.9 | 37.2 | 16.2 | 10.0 |
| Oct-Dec 2017 | 31.9 | 37.2 | 16.2 | 9.8 |
| Nov-Jan 2018 | 32.1 | 37.3 | 16.2 | 9.9 |
| Dec-Feb 2018 | 32.0 | 37.2 | 16.3 | 9.9 |
| Jan-Mar 2018 | 31.9 | 37.1 | 16.4 | 10.0 |
| Feb-Apr 2018 | 31.8 | 36.9 | 16.3 | 10.0 |
| Mar-May 2018 | 31.9 | 37.0 | 16.3 | 10.1 |
| Apr-Jun 2018 | 31.9 | 37.1 | 16.2 | 10.1 |
| May-Jul 2018 | 31.9 | 37.1 | 16.2 | 10.1 |
| Jun-Aug 2018 | 32.1 | 37.3 | 16.3 | 9.8 |
| Jul-Sep 2018 | 32.2 | 37.3 | 16.3 | 9.8 |
| Aug-Oct 2018 | 32.2 | 37.3 | 16.3 | 9.7 |
| Sep-Nov 2018 | 32.0 | 37.1 | 16.3 | 9.7 |
| Oct-Dec 2018 | 32.0 | 37.1 | 16.2 | 9.9 |
| Nov-Jan 2019 | 32.0 | 37.2 | 16.2 | 9.7 |
| Dec-Feb 2019 | 32.2 | 37.4 | 16.3 | 9.7 |
| Jan-Mar 20193 | 32.3 | 37.6 | 16.3 | 9.7 |
| Feb-Apr 2019 | 32.3 | 37.5 | 16.3 | 9.7 |
| Mar-May 2019 | 32.3 | 37.5 | 16.4 | 9.6 |
| Apr-Jun 2019 | 32.1 | 37.3 | 16.3 | 9.6 |
| May-Jul 2019 | 32.0 | 37.2 | 16.3 | 9.8 |
| Jun-Aug 2019 | 31.9 | 37.2 | 16.1 | 10.2 |
| Jul-Sep 2019 | 32.0 | 37.2 | 16.2 | 10.1 |
| Aug-Oct 2019 | 32.0 | 37.3 | 16.3 | 9.9 |
| Sep-Nov 2019 | 31.9 | 37.1 | 16.3 | 9.4 |
| Oct-Dec 2019 | 31.8 | 36.9 | 16.2 | 9.6 |
| Nov-Jan 2020 | 31.8 | 36.9 | 16.1 | 9.8 |
| Dec-Feb 2020 | 31.7 | 36.9 | 16.1 | 9.8 |
| Jan-Mar 2020 | 31.2 | 36.2 | 15.7 | 9.7 |
| Feb-Apr 2020 | 29.3 | 34.1 | 14.4 | 9.4 |
| Mar-May 2020 | 26.7 | 31.1 | 12.5 | 8.9 |
| Apr-Jun 2020 | 25.9 | 30.3 | 11.7 | 8.6 |
| May-Jul 2020 | 26.1 | 30.7 | 11.8 | 8.7 |
| Jun-Aug 2020 | 27.1 | 31.8 | 12.8 | 9.3 |
| Jul-Sep 2020 | 28.2 | 32.7 | 13.7 | 9.5 |
| Aug-Oct 2020 | 29.3 | 33.9 | 14.5 | 9.6 |
| Sep-Nov 2020 | 30.0 | 34.7 | 14.7 | 9.7 |
| Oct-Dec 2020 | 30.2 | 34.9 | 14.8 | 9.6 |
| Nov-Jan 2021 | 29.9 | 34.6 | 14.5 | 10.0 |
| Dec-Feb 2021 | 29.8 | 34.4 | 14.4 | 9.9 |
| Jan-Mar 2021 | 29.5 | 34.0 | 14.2 | 9.9 |
| Feb-Apr 2021 | 30.1 | 34.5 | 14.6 | 9.8 |
| Mar-May 2021 | 30.6 | 35.2 | 15.2 | 10.1 |
| Apr-Jun 2021 | 31.0 | 35.5 | 15.5 | 9.9 |
| May-Jul 2021 | 31.4 | 35.8 | 15.7 | 9.8 |
| Jun-Aug 2021 | 31.4 | 36.0 | 15.9 | 9.5 |
| Jul-Sep 2021 | 31.6 | 36.1 | 16.1 | 9.7 |
| Aug-Oct 2021 | 31.6 | 36.2 | 16.3 | 9.9 |
| Sep-Nov 2021 | 31.5 | 36.2 | 16.3 | 10.1 |
| Oct-Dec 2021 | 31.7 | 36.3 | 16.4 | 10.1 |
| Nov-Jan 2022 | 31.7 | 36.3 | 16.4 | 9.7 |
| Dec-Feb 2022 | 31.8 | 36.4 | 16.6 | 9.7 |
| Jan-Mar 2022 | 31.8 | 36.4 | 16.5 | 9.6 |
| Feb-Apr 2022 | 31.8 | 36.4 | 16.5 | 9.8 |
| Mar-May 2022 | 31.7 | 36.4 | 16.4 | 10.0 |
| Apr-Jun 2022 | 31.7 | 36.3 | 16.4 | 10.2 |
| May-Jul 2022 | 31.7 | 36.4 | 16.4 | 10.2 |
| Jun-Aug 2022 | 32.0 | 36.6 | 16.4 | 10.1 |
| Jul-Sep 2022 | 31.8 | 36.3 | 16.4 | 9.9 |
| Aug-Oct 2022 | 31.7 | 36.4 | 16.3 | 9.8 |
| Sep-Nov 2022 | 31.6 | 36.4 | 16.5 | 9.4 |
| Oct-Dec 2022 | 31.7 | 36.4 | 16.7 | 9.5 |
| Nov-Jan 2023 | 31.8 | 36.5 | 16.8 | 9.3 |
| Dec-Feb 2023 | 31.7 | 36.5 | 16.7 | 9.4 |
| Jan-Mar 2023 | 31.7 | 36.5 | 16.8 | 9.3 |
| Feb-Apr 2023 | 31.9 | 36.6 | 16.7 | 9.2 |
| Mar-May 2023 | 31.7 | 36.5 | 16.7 | 9.1 |
| Apr-Jun 2023 | 31.6 | 36.5 | 16.6 | 8.9 |
| May-Jul 2023 | 31.6 | 36.4 | 16.5 | 9.2 |
| Jun-Aug 2023 | 31.5 | 36.3 | 16.2 | 9.3 |
| Jul-Sep 2023 | 31.5 | 36.2 | 16.2 | 9.4 |
| Aug-Oct 2023 | 31.5 | 36.3 | 16.3 | 9.2 |
| Sep-Nov 2023 | 31.7 | 36.4 | 16.6 | 9.3 |
| Oct-Dec 2023 | 31.7 | 36.4 | 16.4 | 8.9 |
| Nov-Jan 2024 | 31.9 | 36.6 | 16.5 | 9.7 |
| Dec-Feb 2024 | 32.1 | 36.8 | 16.6 | 9.8 |
| Jan-Mar 2024 | 32.0 | 36.6 | 16.6 | 10.0 |
| Feb-Apr 2024 | 31.9 | 36.5 | 16.5 | 9.7 |
| Mar-May 2024 | 32.1 | 36.6 | 16.5 | 9.6 |
| Apr-Jun 2024 | 32.0 | 36.6 | 16.5 | 9.7 |
| May-Jul 2024 | 31.9 | 36.5 | 16.5 | 9.6 |
| Jun-Aug 2024 | 31.9 | 36.6 | 16.7 | 9.6 |
| Jul-Sep 2024 | 32.1 | 36.9 | 16.8 | 9.4 |
| Aug-Oct 2024 | 32.1 | 36.8 | 16.8 | 9.5 |
| Sep-Nov 2024 | 31.9 | 36.6 | 16.7 | 9.4 |
| Oct-Dec 2024 | 31.8 | 36.5 | 16.6 | 9.2 |
| Nov-Jan 2025 | 31.9 | 36.5 | 16.6 | 9.3 |
| Dec-Feb 2025 | 31.9 | 36.6 | 16.4 | 9.5 |
| Jan-Mar 2025 | 31.8 | 36.5 | 16.5 | 9.4 |
| Feb-Apr 2025 | 31.8 | 36.4 | 16.5 | 9.4 |
| Mar-May 2025 | 32.0 | 36.5 | 16.7 | 9.6 |
| Apr-Jun 2025 | 31.9 | 36.6 | 16.6 | 9.4 |
| May-Jul 2025 | 31.8 | 36.5 | 16.5 | 9.4 |
| Jun-Aug 2025 | 31.8 | 36.5 | 16.5 | 9.3 |
| Jul-Sep 2025 | 31.8 | 36.5 | 16.5 | 9.6 |
| Aug-Oct 2025 | 31.9 | 36.6 | 16.6 | 9.7 |
| Sep-Nov 2025 | 31.8 | 36.6 | 16.5 | 9.4 |
Recap
In short, we're working a little less. We're earning a lot more—51% more than we earned 10 years ago. But, our earnings haven't kept up with inflation. The Retail Price Index is up 56% over the same time period, meaning our costs (food, housing, etc.) have risen in cost more than our earnings have risen:
Over the past 10 years...
- Our wages (whole economy, weekly earnings): +51%
- Our costs (RPI): +56%
- How much we work: -1.2%
Thoughts? Please leave a comment below.