Top 5 European Cities for Millenials
Top 5 European Cities for Millenials
1. Zurich
According to publicly available data, Zurich is the best city for millenials hoping to start their careers and enjoy a great quality of life. While the cost of living is quite high in Zurich, average wages were the highest of the cities in our study making Zurich relatively affordable compared to, say, London. Plus the country benefits from a strong economy (Switzerland had the highest GDP per capita). Very few young adults work part time when they'd rather find full-time employment, and there is a low risk of poverty and social exclusion amongst young people. Finally, the lowest levels of pollution and the lowest overall level of crime make Zurich a great place to live.
| Category | Rank |
|---|---|
| Employment Prospects | 4 |
| Cost of Living & Affordability | 11 |
| Entertainment | 5 |
| Health & Safety | 2 |
2. Prague
The second best city in our data study for millenials is Prague. The capital of the Czech Republic struck a nice balance for affordability, with solid wages and a relatively low cost of living making it easier for young people to live comfortably. The Czech Republic also posted the lowest youth and overall unemployment rates and solid GDP growth (4th), suggesting that residents may have an easier time finding good jobs than in other cities. Additionally, the Czech Republic ranked 1st for the lowest risk of poverty or social exclusion amongst 16 to 29 year olds, a possible indicator of wellbeing for young adults. While it's not the sunniest city, Prague has a relatively high number of cafes (3rd) and bars (4th), which are ever popular for young people.
| Category | Rank |
|---|---|
| Employment Prospects | 7 |
| Cost of Living & Affordability | 1 |
| Entertainment | 12 |
| Health & Safety | 5 |
3. Geneva
The third spot in our ranking of millenial-friendly cities went to another Swiss city—Geneva. One of the smallest cities in our study, Geneva stood out for high wages and a safe, healthy environment (similar to Zurich). We estimate that residents of Geneva spend around 37% of their after tax salary on rent, which is significantly less than the average of 59% of wages spent on rent across our study. Given the compact nature of the city, residents are never far from a park, cinema or place to eat or drink.
| Category | Rank |
|---|---|
| Employment Prospects | 5 |
| Cost of Living & Affordability | 14 |
| Entertainment | 7 |
| Health & Safety | 2 |
4. Berlin
For those whose priority is the prospect of good employment Berlin is hard to beat, ranking second in this category to Amsterdam. For example, there is low unemployment, especially for young adults (6.6%), and a high degree of wage equality between men and women (#3 in the study). Berlin also performed admirably when it comes to how the cost of living compares to wages, ranking 5th for rent affordability and 3rd for cost of a night out affordability. On the other hand, Berlin offers fewer parks per square kilometre and an average environment in terms of pollution, safety and sunshine.
| Category | Rank |
|---|---|
| Employment Prospects | 2 |
| Cost of Living & Affordability | 3 |
| Entertainment | 14 |
| Health & Safety | 13 |
5. Vienna
According to the data, Vienna is the safest and healthiest city in our study, with consistently solid performance in terms of pollution (3rd), crime (3rd), peace (1st) and the risk of young adult poverty or social exclusion (ranking 3rd best with 21.4% at risk). Vienna also scored well in terms of affordability, suggesting that young people at the beginning of their careers won't struggle as much financially in Vienna as they might in other cities. However those who prioritise out-of-work activities may not find Vienna as suitable, with slightly below average access to restaurants, bars, cafes, cinemas and parks.
| Category | Rank |
|---|---|
| Employment Prospects | 10 |
| Cost of Living & Affordability | 4 |
| Entertainment | 18 |
| Health & Safety | 1 |
Summary of City Rankings
In order to quantify the appeal of a city to young people, our analysis included four groups of data: employment, cost of living, entertainment and health & safety. We then ranked our 24 European cities according to these factors.
| Rank | City | Country | Employment | Cost of Living | Entertainment | Health & Safety |
|---|---|---|---|---|---|---|
| 1 | Zurich | Switzerland | 4 | 11 | 5 | 2 |
| 2 | Prague | Czech Republic | 7 | 1 | 12 | 5 |
| 3 | Geneva | Switzerland | 5 | 14 | 7 | 2 |
| 4 | Berlin | Germany | 2 | 3 | 14 | 13 |
| 5 | Vienna | Austria | 10 | 4 | 18 | 1 |
| 6 | Amsterdam | Netherlands | 1 | 19 | 6 | 11 |
| 7 | Stockholm | Sweden | 9 | 10 | 13 | 7 |
| 8 | Copenhagen | Denmark | 6 | 16 | 15 | 6 |
| 9 | Oslo | Norway | 3 | 12 | 20 | 9 |
| 10 | Dublin | Ireland | 8 | 23 | 2 | 16 |
| 11 | Lisbon | Portugal | 16 | 20 | 11 | 4 |
| 12 | Brussels | Belgium | 12 | 7 | 10 | 22 |
| 13 | Athens | Greece | 24 | 6 | 3 | 18 |
| 14 | Zagreb | Croatia | 18 | 1 | 24 | 8 |
| 15 | Barcelona | Spain | 19 | 17 | 4 | 12 |
| 16 | Budapest | Hungary | 13 | 7 | 21 | 14 |
| 17 | Warsaw | Poland | 14 | 4 | 22 | 15 |
| 18 | Paris | France | 17 | 18 | 1 | 21 |
| 19 | Madrid | Spain | 20 | 15 | 16 | 9 |
| 20 | Istanbul | Turkey | 15 | 9 | 17 | 24 |
| 21 | Milan | Italy | 21 | 21 | 8 | 17 |
| 22 | London | United Kingdom | 11 | 24 | 9 | 23 |
| 23 | Belgrade | Serbia | 23 | 13 | 23 | 20 |
| 24 | Rome | Italy | 22 | 22 | 19 | 18 |
Employment
To get an idea of job prospects in each city, we analysed a range of economic factors. Our analysis incorporated data on youth unemployment, GDP growth, GDP per capita, wage inequality (that is, the extent to which women and men are paid the same for similar work), actual wages and the percentage of 20 to 29 year olds who are in involuntary part-time work (that is, the percentage of young people who are working part-time but would rather be in full-time employment). While these metrics don't guarantee any individual's job prospects in a given city, we think they broadly represent each city's job market.

| Rank | City | Youth Unemploy. Rank | Unemploy. Rank | Involuntary Part-Time Rank | GDP Growth Rank | GDP per Cap. Rank | Wage Inequality Rank | Wage Rank |
|---|---|---|---|---|---|---|---|---|
| 1 | Amsterdam | 3 | 4 | 5 | 6 | 6 | 7 | 5 |
| 2 | Berlin | 2 | 3 | 3 | 13 | 8 | 3 | 9 |
| 3 | Oslo | 7 | 5 | 9 | 14 | 2 | 1 | 3 |
| 4 | Zurich | 4 | 8 | 2 | 21 | 1 | 4 | 1 |
| 5 | Geneva | 4 | 8 | 2 | 21 | 1 | 4 | 2 |
| 6 | Copenhagen | 8 | 9 | 4 | 12 | 4 | 6 | 4 |
| 7 | Prague | 1 | 1 | 1 | 4 | 15 | 11 | 15 |
| 8 | Dublin | 10 | 11 | 12 | 1 | 3 | 4 | 8 |
| 9 | Stockholm | 12 | 12 | 14 | 11 | 5 | 1 | 6 |
| 10 | Vienna | 6 | 10 | 6 | 8 | 7 | 14 | 11 |
| 11 | London | 9 | 6 | 11 | 17 | 10 | 7 | 7 |
| 12 | Brussels | 13 | 13 | 8 | 18 | 9 | 9 | 10 |
| 13 | Budapest | 5 | 2 | 13 | 5 | 17 | 18 | 22 |
| 14 | Warsaw | 11 | 7 | 10 | 3 | 18 | 15 | 18 |
| 15 | Istanbul | 15 | 18 | 7 | 2 | 20 | 15 | 23 |
| 16 | Lisbon | 14 | 14 | 16 | 10 | 14 | 12 | 20 |
| 17 | Paris | 16 | 15 | 17 | 16 | 11 | 21 | 12 |
| 18 | Zagreb | 17 | 16 | 15 | 9 | 19 | 17 | 19 |
| 19 | Barcelona | 19 | 20 | 19 | 7 | 13 | 20 | 16 |
| 20 | Madrid | 19 | 20 | 19 | 7 | 13 | 20 | 17 |
| 21 | Milan | 20 | 17 | 21 | 19 | 12 | 19 | 13 |
| 22 | Rome | 20 | 17 | 21 | 19 | 12 | 19 | 14 |
| 23 | Belgrade | 18 | 19 | 18 | 15 | 21 | 12 | 24 |
| 24 | Athens | 21 | 21 | 20 | 20 | 16 | 10 | 21 |
Cost of Living and Affordability
Given the burden of student loans, a lack of savings and lower salaries for those in their first jobs, millennials are often price conscious. Therefore it is important to factor in the comparative cost of each city. We simplified this process by focusing on the cost of housing and entertainment (i.e., restaurants, drinks and cinema tickets) using data obtained by Numbeo from actual city residents. Istanbul came out cheapest in terms of the cost of both rent and entertainment. Not surprisingly, the data showed that residents in Geneva, London and Zurich pay the most to live.
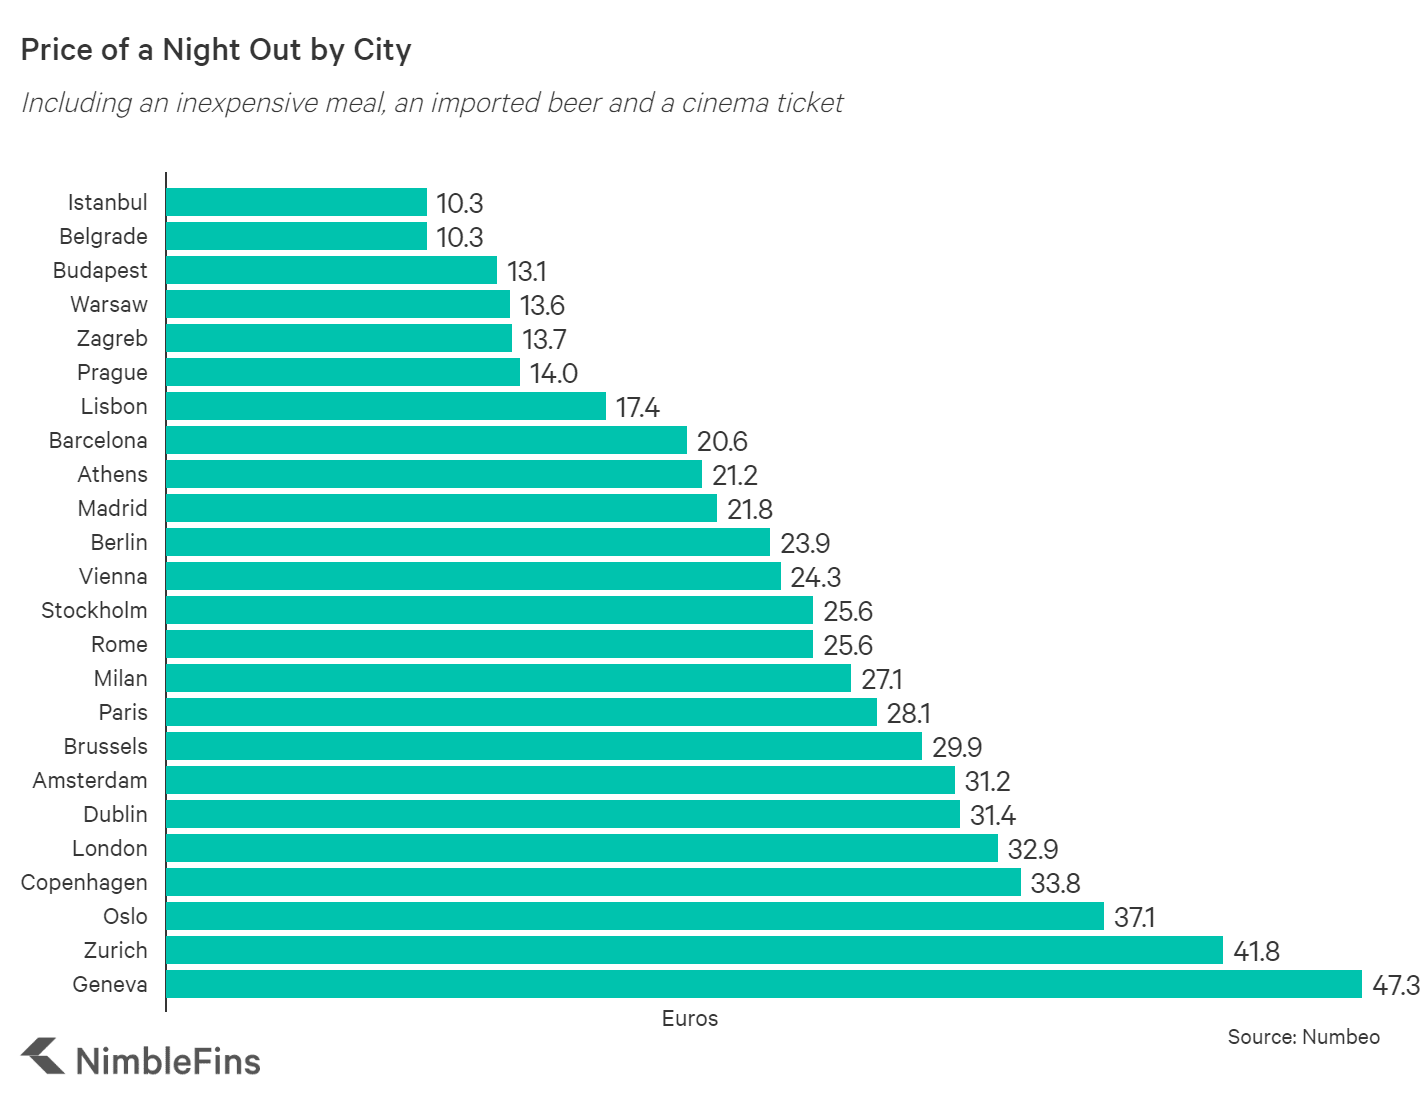
However, it's important to consider both actual costs in a city as well as the affordability of each city—that is, how affordable rent and other living expenses are given typical wages. We found that while Geneva and Zurich are amongst the most expensive cities, they also appear to be the most affordable for those with a job due to higher wages. London, on the other hand, is just as expensive but residents earn lower average wages, making it less affordable. Prague and Zagreb tied for offering the best combination of a low cost of living and wages substantial enough for young people to comfortably pay for their living expenses, on average.
| Rank | City | Cost of Rent Rank | Cost of Night Out Rank | Rent Affordability Rank | Night Out Affordability Rank |
|---|---|---|---|---|---|
| 1 (tie) | Prague | 7 | 6 | 11 | 5 |
| 1 (tie) | Zagreb | 4 | 5 | 10 | 10 |
| 3 | Berlin | 11 | 11 | 5 | 3 |
| 4 | Vienna | 9 | 12 | 6 | 7 |
| 5 | Warsaw | 6 | 4 | 12 | 12 |
| 6 | Athens | 3 | 9 | 7 | 16 |
| 7 (tie) | Brussels | 8 | 17 | 3 | 9 |
| 7 (tie) | Budapest | 5 | 3 | 15 | 14 |
| 9 | Istanbul | 1 | 1 | 18 | 21 |
| 10 | Stockholm | 16 | 13 | 9 | 6 |
| 11 | Zurich | 21 | 23 | 1 | 1 |
| 12 | Oslo | 18 | 22 | 4 | 4 |
| 13 | Belgrade | 2 | 2 | 22 | 23 |
| 14 | Geneva | 23 | 24 | 2 | 2 |
| 15 | Madrid | 12 | 10 | 16 | 15 |
| 16 | Copenhagen | 19 | 21 | 8 | 8 |
| 17 | Barcelona | 13 | 8 | 19 | 17 |
| 18 | Paris | 17 | 16 | 13 | 13 |
| 19 | Amsterdam | 20 | 18 | 14 | 11 |
| 20 | Lisbon | 10 | 7 | 24 | 24 |
| 21 | Milan | 15 | 15 | 17 | 18 |
| 22 | Rome | 14 | 14 | 20 | 20 |
| 23 | Dublin | 22 | 19 | 21 | 19 |
| 24 | London | 24 | 20 | 23 | 22 |
Since millenials spend such a large proportion of their paychecks on entertainment, primarily eating and drinking out, affordability of restaurants and cafes is a key consideration.
Health & Safety
Young people are often conscious of protecting their mental and physical health, as well as with the relative safety of where they live. While it can be difficult to compare cities across these qualities, we focused on data sets that broadly capture an area's safety and health. For example, we incorporated data related to pollution, the risk of young adult poverty or social exclusion (a metric for mental health), life expectancy, crime/safety and hours of sunshine each year, as well as the Global Peace Index. Despite less sunshine, Vienna, Geneva and Zurich performed particularly well in the category overall.

| Rank | City | Pollution Rank | Peace Rank | Young Adult Poverty or Social Exclusion Rank | Life Expectancy Rank | Safety Rank | Sunshine Rank |
|---|---|---|---|---|---|---|---|
| 1 | Vienna | 3 | 1 | 3 | 6 | 3 | 8 |
| 2 (tie) | Geneva | 6 | 6 | 2 | 2 | 5 | 12 |
| 2 (tie) | Zurich | 1 | 6 | 2 | 2 | 1 | 21 |
| 4 | Lisbon | 11 | 2 | 12 | 11 | 8 | 1 |
| 5 | Prague | 9 | 4 | 1 | 16 | 6 | 16 |
| 6 | Copenhagen | 4 | 3 | 18 | 13 | 2 | 14 |
| 7 | Stockholm | 2 | 7 | 11 | 7 | 17 | 13 |
| 8 | Zagreb | 8 | 13 | 7 | 17 | 4 | 11 |
| 9 (tie) | Madrid | 15 | 14 | 16 | 1 | 13 | 3 |
| 9 (tie) | Oslo | 5 | 8 | 15 | 5 | 14 | 15 |
| 11 | Amsterdam | 7 | 12 | 10 | 9 | 9 | 17 |
| 12 | Barcelona | 21 | 14 | 16 | 1 | 16 | 4 |
| 13 | Berlin | 12 | 9 | 8 | 15 | 12 | 19 |
| 14 | Budapest | 13 | 10 | 13 | 20 | 11 | 9 |
| 15 | Warsaw | 14 | 15 | 4 | 18 | 7 | 20 |
| 16 | Dublin | 10 | 5 | 14 | 8 | 21 | 23 |
| 17 | Milan | 20 | 16 | 17 | 4 | 15 | 10 |
| 18 (tie) | Athens | 16 | 20 | 20 | 10 | 20 | 2 |
| 18 (tie) | Rome | 22 | 16 | 17 | 4 | 24 | 5 |
| 20 | Belgrade | 18 | 17 | 19 | 19 | 10 | 6 |
| 21 | Paris | 23 | 19 | 5 | 3 | 23 | 18 |
| 22 | Brussels | 19 | 11 | 6 | 14 | 22 | 22 |
| 23 | London | 17 | 18 | 9 | 12 | 18 | 24 |
| 24 | Istanbul | 24 | 21 | 21 | 21 | 19 | 7 |
Entertainment
How a young person spends their time outside of work can have a significant bearing on their happiness. To gauge how friendly a city is towards millenials in this regard, we included data on the proportion of population aged 20 to 34 years old, the number of parks per square kilometre, the number of cinemas per square kilometre and a ranking of restaurants, bars and cafes. For this we ranked cities on the absolute number of restaurants, bars and cafes, the number per square kilometre and also the number per 10,000 residents. Considering the number of venues per square kilometre gives an indication of how far a person might need to travel to reach a park, cinema, restaurant, cafe or bar on average.

| Rank | City | Proportion of Young People Rank | Parks per Sq Km Rank | Cinemas per Sq Km Rank | Restaurants, Cafes and Bars Rank |
|---|---|---|---|---|---|
| 1 | Paris | 14 | 1 | 2 | 1 |
| 2 | Dublin | 2 | 3 | 7 | 9 |
| 3 | Athens | 10 | 6 | 1 | 10 |
| 4 | Barcelona | 20 | 2 | 8 | 2 |
| 5 | Zurich | 6 | 7 | 3 | 16 |
| 6 | Amsterdam | 5 | 10 | 12 | 6 |
| 7 | Geneva | 11 | 4 | 6 | 13 |
| 8 | Milan | 22 | 5 | 4 | 3 |
| 9 | London | 7 | 13 | 17 | 7 |
| 10 | Brussels | 9 | 8 | 11 | 17 |
| 11 | Lisbon | 24 | 12 | 5 | 5 |
| 12 | Prague | 18 | 9 | 15 | 4 |
| 13 | Stockholm | 8 | 11 | 14 | 15 |
| 14 | Berlin | 13 | 16 | 10 | 12 |
| 15 | Copenhagen | 1 | 15 | 20 | 19 |
| 16 | Madrid | 21 | 17 | 9 | 8 |
| 17 | Istanbul | 3 | 21 | 16 | 18 |
| 18 | Vienna | 12 | 14 | 19 | 14 |
| 19 | Rome | 23 | 18 | 13 | 11 |
| 20 | Oslo | 4 | 22 | 24 | 23 |
| 21 | Budapest | 17 | 20 | 18 | 20 |
| 22 | Warsaw | 15 | 19 | 22 | 21 |
| 23 | Belgrade | 19 | 24 | 21 | 22 |
| 24 | Zagreb | 16 | 23 | 23 | 24 |
Regardless of where you decide to move, be sure to invest in contents insurance in the city of your choice. It is designed for renters and can help protect your belongings in the event of calamities like fire, flood and theft. Don't be one of the millenials who doesn't get contents insurance until it's too late (e.g., after you experience a loss). To learn more about contents insurance in the UK, read our article, Contents Insurance: What you Need to Know.
Likewise, be sure you're covered by a suitable car insurance plan if you get behind the wheel, including if you're driving a friend's car. Those in the UK can read about good options in our article, Cheap Car Insurance. Or, for motorcycle riders, in our article on Cheap Motorcycle Insurance. Millenials moving to other countries are sure to find suitable options as well from local resources.
Finally, when you inevitably travel between your host country and home, be sure your travels are covered by a good travel insurance policy.
Methodology and Limitations
In order to quantify how millenial-friendly a city is, we gathered publicly-available data from sources including the World Bank, Eurostat and the World Health Organization. We ranked each city across a number of metrics for each category (i.e., Employment, Cost of Living/Affordability, Entertainment and Health & Safety).
Employment data included unemployment rates (youth and overall), GDP growth, GDP per capita, wage inequality and average wages.
Cost of Living data included average rents for a one bedroom flat in the city center as well as costs of common entertainment expenses such as beer, inexpensive meals and cinema tickets (our proxy for the "cost of a night out"). We ranked cities according to two metrics: absolute costs and the affordability of these costs given local wages. For example, rent affordability was calculated as the ratio of the average monthly net salary in a city to the average monthly cost of a 1 bedroom rental in the city centre. Cost of a night out affordability was calculated as the ratio of the average monthly net salary less a 1 bedroom rental cost to the cost of a night out (i.e., an inexpensive meal, one imported beer and a cinema ticket).
Entertainment data included the proportion of young people in a city (i.e., 20 to 34 year olds) as a measure of how "young" a city is, the number of parks and cinemas per square kilometre (to indicate how far one might be from these leisure locations) and a rank for restaurants, cafes and bars that reflected the absolute number of each in a city as well as the number per square kilometre and the number per 10,000 residents.
Health & Safety data included the number of hours of sun per year, the amount of pollution in the air, life expectancy (as a measure of the health of a population), the Global Peace Index, the Numbeo crime index (which captures how safe people feel in a city) and a measure of the percent of young people at risk of poverty or social exclusion (as another measure of wellbeing).
Sources
Employment
- Word Bank: Youth unemployment rates by country, unemployment rates by country, GDP growth, GDP per capita, Wage inequality
- Eurostat: Involuntary part-time employment as percentage of the total part-time employment for young people by country
- Numbeo: Wages by city
Cost of Living
- Numbeo: Cost of rent for a one-bedroom in the city centre, an imported beer, an inexpensive meal, wages and a cinema ticket, all by city
Health & Safety
- World Health Organization: Life expectancy
- Vision of Humanity: Global Peace Index
- Eurostat: People at risk of poverty or social exclusion aged 16 to 29
- Numbeo: Pollution, safety/crime index by city
- Current Results and Weather Online: Hours of sunshine per year by city
Entertainment
- Eurostat: Proportion of population aged 25 to 34 years
- Google Maps: Number of cinemas per city
- Trip Advisor: Number of parks, restaurants, cafes and bars per city
- Wikipedia: Land area of each city
Data
Here is a selection of data we used in our study.
| City | Youth Unemployment (Aged 15 to 24) | Wage Inequality | Wages (Average, After Tax) | Crime Index | Percentage of Population Aged 20 to 34 |
|---|---|---|---|---|---|
| Amsterdam | 15% | 0.65 | € 2,522 | 33.7 | 28% |
| Athens | 75% | 0.63 | € 750 | 49.6 | 24% |
| Barcelona | 68% | 0.50 | € 1,328 | 45.8 | 19% |
| Belgrade | 55% | 0.58 | € 386 | 37.0 | 19% |
| Berlin | 12% | 0.72 | € 2,141 | 41.0 | 23% |
| Brussels | 18% | 0.64 | € 2,107 | 51.3 | 24% |
| Budapest | 30% | 0.52 | € 738 | 37.0 | 21% |
| Copenhagen | 14% | 0.68 | € 2,826 | 21.6 | 35% |
| Dublin | 27% | 0.70 | € 2,184 | 50.6 | 32% |
| Geneva | 11% | 0.70 | € 4,615 | 26.5 | 24% |
| Istanbul | 16% | 0.56 | € 429 | 48.8 | 30% |
| Lisbon | 52% | 0.58 | € 869 | 33.5 | 13% |
| London | 26% | 0.65 | € 2,303 | 47.8 | 25% |
| Madrid | 68% | 0.50 | € 1,318 | 41.4 | 18% |
| Milan | 80% | 0.51 | € 1,510 | 45.0 | 16% |
| Oslo | 20% | 0.74 | € 3,041 | 44.0 | 28% |
| Paris | 55% | 0.49 | € 1,936 | 53.0 | 22% |
| Prague | 7% | 0.61 | € 1,374 | 27.6 | 19% |
| Rome | 80% | 0.51 | € 1,382 | 54.3 | 15% |
| Stockholm | 39% | 0.74 | € 2,349 | 47.6 | 25% |
| Vienna | 16% | 0.57 | € 2,004 | 22.6 | 23% |
| Warsaw | 25% | 0.56 | € 954 | 33.5 | 22% |
| Zagreb | 46% | 0.53 | € 870 | 26.0 | 21% |
| Zurich | 11% | 0.70 | € 5,207 | 19.0 | 26% |
| City | Cost of a Beer | Cost of Cinema Ticket | Cost of an Inexpensive Meal | Cost of Night Out | Number of Bars, Cafes and Restaurants per Square Kilometre |
|---|---|---|---|---|---|
| Amsterdam | € 2.6 | € 13.6 | € 15.0 | € 31.2 | 21.0 |
| Athens | € 2.1 | € 9.1 | € 10.0 | € 21.2 | 68.7 |
| Barcelona | € 1.5 | € 9.1 | € 10.0 | € 20.6 | 100.0 |
| Belgrade | € 1.3 | € 4.8 | € 4.2 | € 10.3 | 4.6 |
| Berlin | € 1.4 | € 12.5 | € 10.0 | € 23.9 | 9.1 |
| Brussels | € 2.5 | € 12.4 | € 15.0 | € 29.9 | 22.8 |
| Budapest | € 1.2 | € 6.5 | € 5.4 | € 13.1 | 6.1 |
| Copenhagen | € 2.5 | € 15.2 | € 16.1 | € 33.8 | 14.5 |
| Dublin | € 2.8 | € 13.6 | € 15.0 | € 31.4 | 25.1 |
| Geneva | € 6.2 | € 20.0 | € 21.1 | € 47.3 | 38.4 |
| Istanbul | € 2.3 | € 4.7 | € 3.3 | € 10.3 | 8.7 |
| Lisbon | € 1.9 | € 8.0 | € 7.5 | € 17.4 | 48.1 |
| London | € 2.8 | € 16.2 | € 13.9 | € 32.9 | 14.5 |
| Madrid | € 1.6 | € 10.2 | € 10.0 | € 21.8 | 18.9 |
| Milan | € 1.9 | € 10.2 | € 15.0 | € 27.1 | 42.0 |
| Oslo | € 3.9 | € 15.7 | € 17.4 | € 37.1 | 3.0 |
| Paris | € 2.6 | € 12.5 | € 13.0 | € 28.1 | 168.9 |
| Prague | € 1.4 | € 8.0 | € 4.7 | € 14.0 | 20.9 |
| Rome | € 1.6 | € 9.1 | € 15.0 | € 25.6 | 8.9 |
| Stockholm | € 2.0 | € 14.1 | € 9.5 | € 25.6 | 16.7 |
| Vienna | € 2.0 | € 11.4 | € 11.0 | € 24.3 | 10.7 |
| Warsaw | € 1.3 | € 7.7 | € 4.6 | € 13.6 | 6.0 |
| Zagreb | € 1.6 | € 5.4 | € 6.7 | € 13.7 | 1.4 |
| Zurich | € 2.7 | € 18.0 | € 21.1 | € 41.8 | 22.9 |