UK Food Prices 2020
Average Food Prices UK
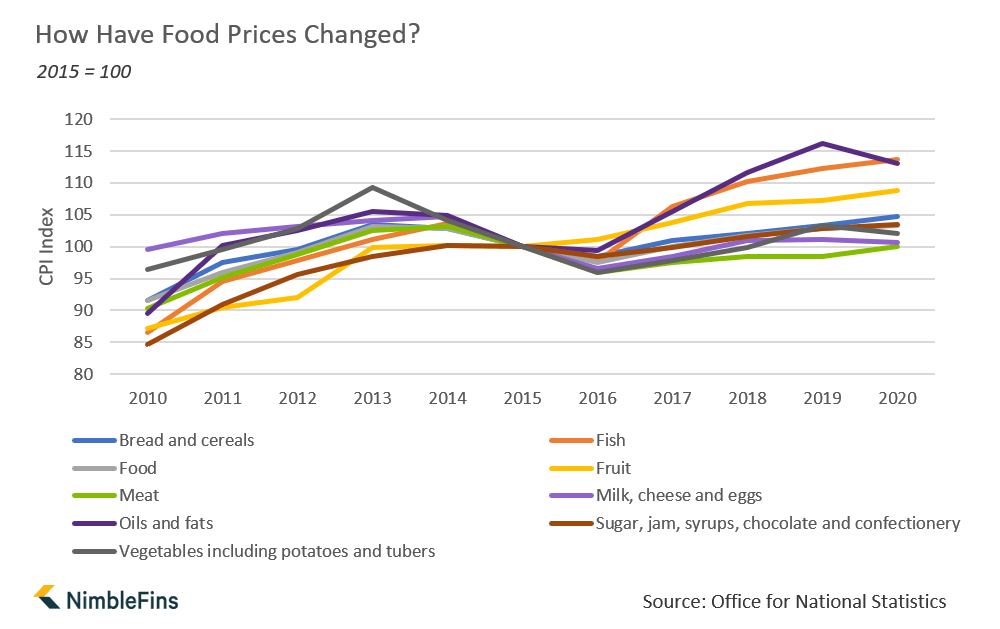
Food prices in the UK have increased 13% in the past ten years, but only 0.5% in the last year, according to Consumer Price Index (CPI) data from the Office for National Statistics. This is less the change in the overall CPI (22% from 2010 to 2020 and 0.8% last year) which means food has risen in price, but less so than other common household expenditure items.
While alcohol prices have increased around the same amount as food (a 12% increase over ten years or 1% over one year), non-alcoholic drinks like soft drinks have gone up more—1.8% in the past year alone, or 22% over ten years.
| Food Price Index UK | CPI 2010 | CPI 2019 | CPI 2020 | 1-Year Change | 10-Year Change |
|---|---|---|---|---|---|
Overall CPI | 89.4 | 91.5 | 108.7 | 18.80% | 21.59% |
Food | 91.5 | 102.9 | 103.4 | 0.49% | 13.01% |
Non-alcoholic beverages | 88.1 | 105.5 | 107.4 | 1.80% | 21.91% |
Alcoholic beverages | 90.8 | 101 | 102 | 0.99% | 12.33% |

When considered over the past 10 years, there are four major food categories for which we're paying at least 20% more for now: fish, fruit, sugar (including jam, syrups, chocolate and confectionery) and oils and fats.
| Food Price Index UK, by Category | CPI 2010 | CPI 2019 | CPI 2020 | 1-Year Change | 10-Year Change |
|---|---|---|---|---|---|
| Fish | 86.5 | 112.2 | 113.6 | 1.25% | 31.33% |
| Fruit | 87.1 | 107.3 | 108.8 | 1.40% | 24.91% |
| Sugar, jam, syrups, chocolate and confectionery | 84.7 | 102.8 | 103.5 | 0.68% | 22.20% |
| Oils and fats | 89.6 | 116.2 | 113 | -2.75% | 26.12% |
| Bread and cereals | 91.6 | 103.4 | 104.8 | 1.35% | 14.41% |
| Meat | 90.3 | 98.4 | 100.1 | 1.73% | 10.85% |
| Vegetables including potatoes and tubers | 96.4 | 103.3 | 102 | -1.26% | 5.81% |
| Milk, cheese and eggs | 99.5 | 101.1 | 100.7 | -0.40% | 1.21% |
| Food | 91.5 | 102.9 | 103.4 | 0.49% | 13.01% |
Grocery Prices UK: Carrots to Tea Bags
We also looked at Retail Price Index (RPI) data and found how grocery prices have changed for specific popular food items. Given that the average monthly cost of groceries per person in the UK is £115, RPI data can tell us which items on our shopping lists are getting cheaper or more expensive compared to last year.
Of the popular foods we tested, all cost less in 2020 than in 2019. For example, the average price of sugar dropped 3% in the past year to 73p per kilo; coffee is down to £3 per 227 grams. Carrots dropped 15% to £0.58 per kilo on average, and roasting chickens are down 8% to £2.54 per kg.
However over the past 10 years, the average retail price of sausages has gone up 22% and ground coffee is up 27%. On the other hand, carrots cost 26% less than they did 10 years ago!
| Grocery Prices UK | 2010 | 2019 | 2020 | 1-Year Change | 30-Year Change |
|---|---|---|---|---|---|
| Sugar, kg | £0.95 | £0.75 | £0.73 | -3% | -23% |
| Ground coffee, 227g | £2.37 | £3.05 | £3.00 | -2% | 27% |
| Carrots, kg | £0.78 | £0.68 | £0.58 | -15% | -26% |
| Banana, kg | £0.98 | £0.95 | £0.87 | -8% | -11% |
| Bacon, kg | £8.63 | £7.25 | £7.01 | -3% | -19% |
| White bread, loaf | £1.20 | £1.06 | £1.05 | -1% | -13% |
| Milk, pint | £0.44 | £0.44 | £0.43 | -2% | -2% |
| Sausages, kg | £4.05 | £5.00 | £4.93 | -1% | 22% |
| Cheddar cheese, kg £ | 7.79 | £7.09 | £6.89 | -3% | -12% |
| Tea bags, 250g | £1.97 | £2.03 | £2.01 | -1% | 2% |
| Roasting Chicken, kg | £2.88 | £2.75 | £2.54 | -8% | -12% |
| Mince, kg | £6.02 | £6.71 | £6.39 | -5% | 6% |
How UK Food Prices Compare to Other Countries
According to Euromonitor, the UK ranks 3rd out of 110 countries for the lowest share of consumer expenditures that is spent on food at home. UK consumers spend just 8.1% of their consumer expenditures on food—behind only the US and Singapore where consumers allocate 6.4% and 6.9% of their consumer spending to food to be consumed at home.
This is only possible because food prices in the UK are relatively low compared to the rest of the world.
| Country | Expenditure on food (USD per person) | Consumer expenditures (USD per person) | Food Spend/Consumer Spend |
|---|---|---|---|
| USA | 2,626 | 41,311 | 6.4% |
| Singapore | 1,503 | 21,907 | 6.9% |
| United Kingdom | 2,168 | 26,770 | 8.1% |
| Ireland | 2,099 | 23,267 | 9.0% |
| Canada | 2,351 | 25,961 | 9.1% |
| Switzerland | 3,909 | 42,714 | 9.2% |
| Australia | 3,004 | 32,390 | 9.3% |
| Germany | 2,563 | 23,918 | 10.7% |
| Netherlands | 2,621 | 23,083 | 11.4% |
| Spain | 2,218 | 18,287 | 12.1% |
| France | 2,983 | 22,586 | 13.2% |
| New Zealand | 3,278 | 24,482 | 13.4% |
| Belgium | 3,035 | 22,606 | 13.4% |
| Italy | 2,987 | 21,032 | 14.2% |
| Poland | 1,480 | 8,852 | 16.7% |
| Greece | 2,511 | 14,701 | 17.1% |
| Turkey | 1,210 | 5,544 | 21.8% |
FAQs
While UK food prices rose around 0.5% last year (2020). From 2010 to 2020, food prices rose 13%.
Food prices in the UK rose 0.5% from 2019 to 2020.
Food prices are affected by many factors, including oil prices (affects the cost to deliver food from farm to consumer), weather (if extreme weather conditions affect crops then prices are likely to rise due to shortages), demand (again, basic supply-demand principles) and even tariffs.
The expectation is that food prices would increase if there's a no-deal Brexit, but there are a lot of factors and uncertainty surrounding this issue.
While food prices can vary from year to year with food prices actually going down in some years, on average food prices rise just over 1% a year. We expect this trend to continue.
This is a bit of a chicken and egg question. Inflation is a measure of how prices are rising for a basket of goods, including food. So when food prices rise, inflation rises. However, food prices can be affected by other items in the inflation basket. For example, if the price of oil goes up then food prices might rise, because it's more costly to ship food to consumers. Similarly, if the price of animal feed (e.g., corn) increases then the price of meat may increase.