How Many Hours do You Work to Afford Christmas?
We not only spend months shopping and preparing for Christmas—most of us also spend months paying for it. Whether you work full time or have a part-time job just for Christmas, how many hours do we actually work to pay for all the gifts, food, drink and decorations we buy for friends and family? It varies drastically depending on where you work. We've calculated how long you'll have to work to pay for Christmas for areas small and large around the UK.
Average Hours Worked in UK to Afford Christmas
On average, each adult in the UK has to work 33.4 hours to cover the £452 they spend at Christmas each year. We calculated that the average UK employee earns £16.72 an hour pre tax, or £13.56 an hour after income tax and national insurance. Dividing £452 of Christmas spending by £13.56 after-tax pay per hour means the average worker clocks 33.4 hours of work to pay for Christmas.
| How long do we spend working to pay for Christmas? | |
|---|---|
| Average hourly wage (pre tax) | £16.72 |
| Average hourly wage (post tax) | £13.56 |
| Average Christmas spend per adult | £452 |
| Average time spent working to pay for Christmas | 33.4 hours |
However, the number of hours we have to work varies drastically depending on which city, town or region you job is based.
Regional Differences
With the advent of massive online retailers like Amazon and national grocery chains, the majority of Christmas expenses—from food to drinks to gifts—cost the same around the country. For example, it costs the same to buy a turkey and bottle of Prosecco from Tesco in London as it does in York. Same goes for gifts ordered online—and you can even by your Christmas tree online! That means that people in some areas have to work a lot more to buy the same Christmas experience. What's the real difference in hours worked?
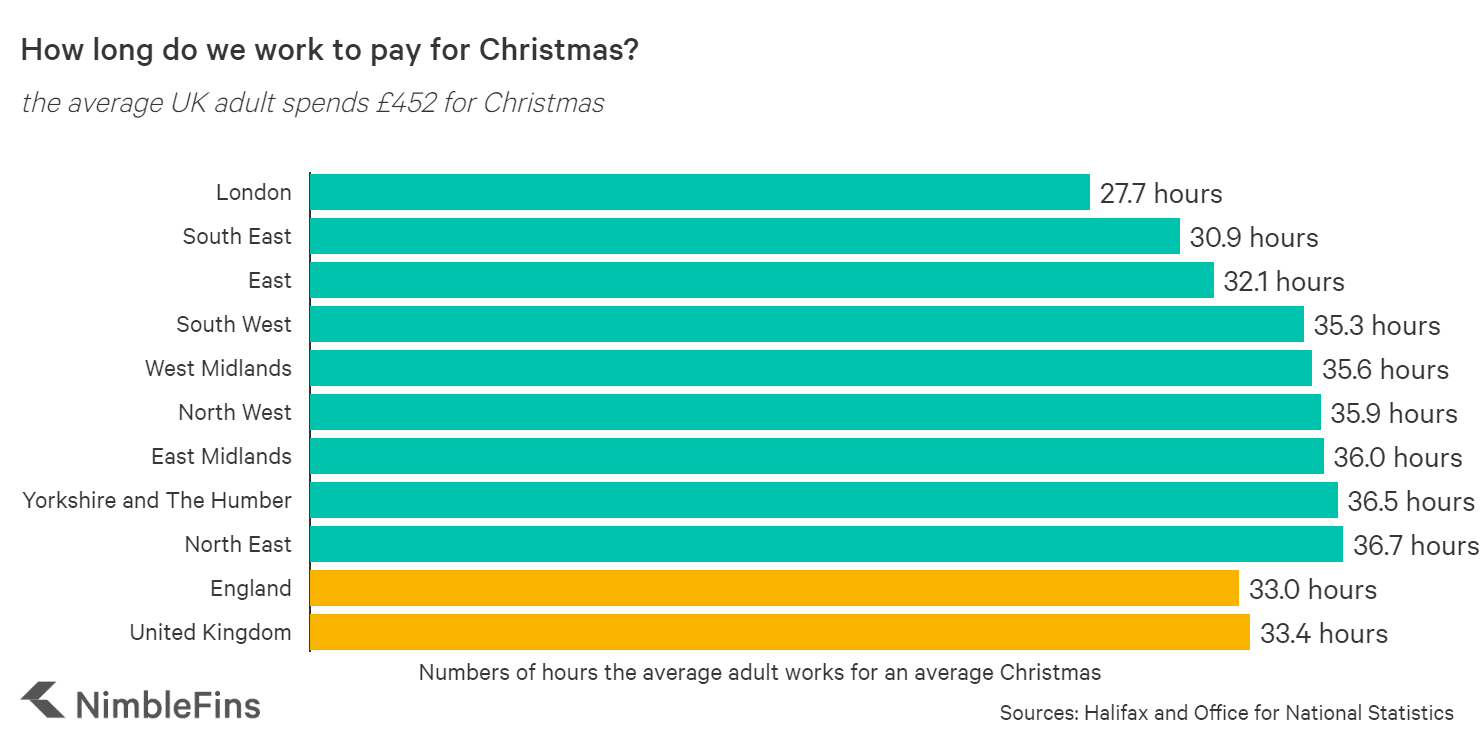
Not surprisingly, those in London earn the highest wages and therefore work the least to pay for Christmas. However, the average London worker still has to work 27.7 hours to buy Christmas gifts and pay for other holiday expenses, which is 17% less than the UK average. Those in the East Midlands, Yorkshire and the Humber and the North East all work at least 36 hours to afford the same Christmas.
| How long do you have to work to afford Christmas? | Hours |
|---|---|
| London | 27.7 |
| South East | 30.9 |
| East | 32.1 |
| South West | 35.3 |
| West Midlands | 35.6 |
| North West | 35.9 |
| East Midlands | 36.0 |
| Yorkshire and The Humber | 36.5 |
| North East | 36.7 |
| England | 33.0 |
| United Kingdom | 33.4 |
Which Cities and Towns Work the Most and Least for Christmas?
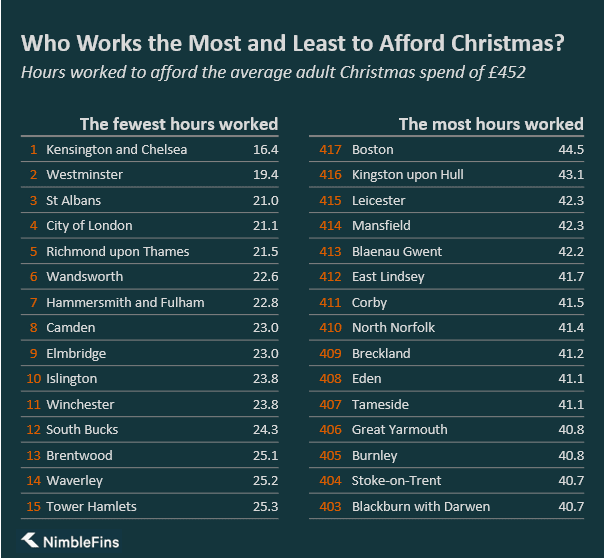
Digging deeper into the data, we found the 10 local areas where workers have to labour for the fewest and most hours to make Christmas special. London boroughs dominated the top 15, with Kensington & Chelsea residents needing to work for just 16.4 hours to afford Christmas.
However, there were a number of other areas outside of London where people also have to work significantly less than their UK peers to pay for their Christmas experience. In particular, those with jobs in St Albans, Hertfordshire work just 21 hours to earn the average £452 contribution to their family's Christmas budget. Other out-of-London localities in the top 15 include Elmbridge, Winchester, South Bucks, Brentwood and Waverly. Tower Hamlets in London rounds out the top 15 with workers working 25.3 hours for Christmas.
| 15 Areas Where People Work the Least to pay for Christmas | Hours |
|---|---|
| Kensington and Chelsea | 16.4 |
| Westminster | 19.4 |
| St Albans | 21.0 |
| City of London | 21.1 |
| Richmond upon Thames | 21.5 |
| Wandsworth | 22.6 |
| Hammersmith and Fulham | 22.8 |
| Camden | 23.0 |
| Elmbridge | 23.0 |
| Islington | 23.8 |
| Winchester | 23.8 |
| South Bucks | 24.3 |
| Brentwood | 25.1 |
| Waverley | 25.2 |
| Tower Hamlets | 25.3 |
In contrast, those working in Boston have to work the most hours if they want the same Christmas experience, which costs £452 per adult on average: 44.5 hours, which is 33.5% more than the UK average of 33.4 hours. Not far behind are Kingston upon Hull, Leicester, Mansfield and Blaenau Gwent—workers in these areas would spend over 42 hours on average working to pay for an average amount of Christmas spending.
| 15 Areas Where People Work the Most to pay for Christmas | Hours |
|---|---|
| Boston | 44.5 |
| Kingston upon Hull | 43.1 |
| Leicester | 42.3 |
| Mansfield | 42.3 |
| Blaenau Gwent / Blaenau Gwent | 42.2 |
| East Lindsey | 41.7 |
| Corby | 41.5 |
| North Norfolk | 41.4 |
| Breckland | 41.2 |
| Eden | 41.1 |
| Tameside | 41.1 |
| Great Yarmouth | 40.8 |
| Burnley | 40.8 |
| Stoke-on-Trent | 40.7 |
| Blackburn with Darwen | 40.7 |
To see where your local area ranks among 425 localities in the UK, see our full table at the bottom of this study.
No matter where you work and regardless of your household budget, read our top tips for saving money at Christmas. For example, by starting to save just £10 a week in January you can have over £500 socked away for the next Christmas.
Methodology
To find the number of hours worked to afford Christmas, we divided the average Christmas spend per adult (£452) by the average after-tax hourly wage in areas around the UK. To find the average after-tax hourly wage we analysed data from the Office for National Statistics (ONS) on average hourly wages and average number of hours worked per week by place of work in areas around the UK. Using these values (and assuming adults work 50 weeks a year) we first calculated annual pre-tax income. Then to find out how much an adult typically takes home, we used an income tax calculator to calculate income tax and national insurance and determine the take-home pay for each given annual income. Then we divided this annual take-home pay number by the average hours worked in each area to arrive at an average after-tax hourly wage number for each area.
In reality people working in areas with lower wages will likely spend less than average on Christmas, and vice versa. This study shows how many hours the average worker would have to log if they wanted the average Christmas experience.
Note: while each adult spends around £450, each household spends around £800 on average on Christmas. While we often prefer to talk about household spending, for the purposes of this article it seemed more suitable to talk in terms of spending per adult—since we wanted a sense of how many hours each adult would need to work to earn their share.
How Many Hours Worked for Christmas in Your Area?
See where your local area ranks out of 417 localities in the UK. Areas are organized by region (e.g., North East, London, etc.) for ease of finding your area and comparing to neighboring places.
| Rank (out of 417 areas) | Region | Local area | Avg hourly wage | Avg hours worked for Xmas | % difference from UK avg |
|---|---|---|---|---|---|
| North East | £14.90 | 36.7 | 10.0% | ||
| 288 | Darlington | £14.89 | 36.7 | 10.1% | |
| 335 | Hartlepool | £14.41 | 37.9 | 13.7% | |
| 388 | Middlesbrough | £13.31 | 40.1 | 20.1% | |
| 400 | Redcar and Cleveland | £13.31 | 40.4 | 21.2% | |
| 280 | Stockton-on-Tees | £14.97 | 36.5 | 9.5% | |
| 283 | County Durham | £15.05 | 36.6 | 9.7% | |
| 173 | Northumberland | £16.21 | 34.0 | 1.8% | |
| 292 | Tyne and Wear Met County | £14.84 | 36.8 | 10.4% | |
| 343 | Gateshead | £14.18 | 38.3 | 14.7% | |
| 204 | Newcastle upon Tyne | £15.85 | 34.7 | 4.1% | |
| 211 | North Tyneside | £15.78 | 34.9 | 4.6% | |
| 325 | South Tyneside | £14.57 | 37.5 | 12.5% | |
| 375 | Sunderland | £13.90 | 39.0 | 17.0% | |
| North West | £15.24 | 35.9 | 7.6% | ||
| 403 | Blackburn with Darwen | £13.11 | 40.7 | 21.9% | |
| 395 | Blackpool | £13.22 | 40.3 | 20.9% | |
| 308 | Halton | £14.77 | 37.3 | 11.8% | |
| 172 | Warrington | £16.48 | 33.9 | 1.5% | |
| 117 | Cheshire East | £17.62 | 31.8 | -4.6% | |
| 180 | Cheshire West and Chester | £16.14 | 34.4 | 3.0% | |
| 264 | Cumbria | £15.25 | 36.1 | 8.2% | |
| 251 | Allerdale | £15.25 | 35.9 | 7.5% | |
| 205 | Barrow-in-Furness | £15.94 | 34.8 | 4.2% | |
| 360 | Carlisle | £13.90 | 38.7 | 16.0% | |
| 107 | Copeland | £17.81 | 31.5 | -5.6% | |
| 408 | Eden | £12.96 | 41.1 | 23.3% | |
| 233 | South Lakeland | £15.68 | 35.4 | 6.0% | |
| 276 | Greater Manchester Met County | £15.12 | 36.4 | 9.2% | |
| 354 | Bolton | £14.08 | 38.5 | 15.5% | |
| 244 | Bury | £15.43 | 35.7 | 7.0% | |
| 300 | Manchester | £14.63 | 37.1 | 11.2% | |
| 377 | Oldham | £13.75 | 39.1 | 17.3% | |
| 344 | Rochdale | £14.18 | 38.3 | 14.7% | |
| 341 | Salford | £14.31 | 38.2 | 14.5% | |
| 142 | Stockport | £17.16 | 32.7 | -2.0% | |
| 407 | Tameside | £13.21 | 41.1 | 23.1% | |
| 54 | Trafford | £20.00 | 28.6 | -14.2% | |
| 317 | Wigan | £14.59 | 37.5 | 12.3% | |
| 253 | Lancashire | £15.33 | 35.9 | 7.7% | |
| 405 | Burnley | £13.31 | 40.8 | 22.2% | |
| 169 | Chorley | £16.54 | 33.7 | 1.1% | |
| 126 | Fylde | £17.55 | 32.1 | -3.7% | |
| 386 | Hyndburn | £13.59 | 39.9 | 19.7% | |
| 248 | Lancaster | £15.39 | 35.8 | 7.3% | |
| 285 | Pendle | £14.92 | 36.7 | 9.8% | |
| 332 | Preston | £14.32 | 37.9 | 13.6% | |
| 105 | Ribble Valley | £18.01 | 31.5 | -5.6% | |
| 262 | Rossendale | £15.27 | 36.1 | 8.1% | |
| 304 | South Ribble | £14.81 | 37.2 | 11.5% | |
| 171 | West Lancashire | £16.30 | 33.8 | 1.3% | |
| 309 | Wyre | £14.55 | 37.3 | 11.8% | |
| 266 | Merseyside Met County | £15.24 | 36.1 | 8.3% | |
| 346 | Knowsley | £14.28 | 38.3 | 14.8% | |
| 240 | Liverpool | £15.47 | 35.6 | 6.7% | |
| 272 | St. Helens | £15.19 | 36.3 | 8.7% | |
| 275 | Sefton | £15.03 | 36.4 | 9.0% | |
| 235 | Wirral | £15.57 | 35.4 | 6.0% | |
| Yorkshire and The Humber | £14.98 | 36.5 | 9.4% | ||
| 162 | East Riding of Yorkshire | £16.72 | 33.4 | 0.0% | |
| 416 | Kingston upon Hull | £12.25 | 43.1 | 29.2% | |
| 398 | North East Lincolnshire | £13.43 | 40.4 | 21.1% | |
| 340 | North Lincolnshire | £14.32 | 38.2 | 14.4% | |
| 216 | York | £15.64 | 35.0 | 4.8% | |
| 220 | North Yorkshire | £15.83 | 35.0 | 5.0% | |
| 252 | Craven | £15.55 | 35.9 | 7.5% | |
| 263 | Hambleton | £15.25 | 36.1 | 8.2% | |
| 110 | Harrogate | £17.79 | 31.7 | -5.0% | |
| 286 | Richmondshire | £14.68 | 36.7 | 9.9% | |
| 289 | Ryedale | £14.77 | 36.7 | 10.1% | |
| 402 | Scarborough | £13.13 | 40.6 | 21.7% | |
| 165 | Selby | £16.79 | 33.6 | 0.7% | |
| 320 | South Yorkshire Met County | £14.47 | 37.5 | 12.4% | |
| 356 | Barnsley | £14.07 | 38.6 | 15.6% | |
| 383 | Doncaster | £13.66 | 39.7 | 19.1% | |
| 350 | Rotherham | £14.10 | 38.5 | 15.3% | |
| 250 | Sheffield | £15.36 | 35.9 | 7.5% | |
| 268 | West Yorkshire Met County | £15.23 | 36.2 | 8.4% | |
| 328 | Bradford | £14.52 | 37.7 | 12.9% | |
| 247 | Calderdale | £15.29 | 35.8 | 7.2% | |
| 223 | Kirklees | £15.69 | 35.1 | 5.2% | |
| 221 | Leeds | £15.82 | 35.0 | 5.0% | |
| 345 | Wakefield | £14.18 | 38.3 | 14.7% | |
| East Midlands | £15.30 | 36.0 | 7.9% | ||
| 208 | Derby | £15.99 | 34.9 | 4.6% | |
| 415 | Leicester | £12.47 | 42.3 | 26.9% | |
| 392 | Nottingham | £13.27 | 40.2 | 20.4% | |
| 210 | Rutland | £15.78 | 34.9 | 4.6% | |
| 226 | Derbyshire | £15.64 | 35.2 | 5.5% | |
| 174 | Amber Valley | £16.30 | 34.0 | 1.9% | |
| 394 | Bolsover | £13.23 | 40.3 | 20.8% | |
| 385 | Chesterfield | £13.53 | 39.8 | 19.2% | |
| 118 | Derbyshire Dales | £17.48 | 31.9 | -4.3% | |
| 258 | Erewash | £15.29 | 36.0 | 8.0% | |
| 195 | High Peak | £15.93 | 34.6 | 3.6% | |
| 197 | North East Derbyshire | £15.68 | 34.6 | 3.7% | |
| 128 | South Derbyshire | £17.48 | 32.3 | -3.3% | |
| 175 | Leicestershire | £16.30 | 34.0 | 1.9% | |
| 183 | Blaby | £16.24 | 34.4 | 3.0% | |
| 230 | Charnwood | £15.62 | 35.3 | 5.7% | |
| 73 | Harborough | £19.31 | 29.6 | -11.2% | |
| 176 | Hinckley and Bosworth | £16.25 | 34.1 | 2.3% | |
| 299 | Melton | £14.64 | 37.1 | 11.1% | |
| 185 | North West Leicestershire | £16.11 | 34.4 | 3.1% | |
| 259 | Oadby and Wigston | £15.18 | 36.0 | 8.0% | |
| 358 | Lincolnshire | £14.15 | 38.6 | 15.8% | |
| 417 | Boston | £11.97 | 44.5 | 33.5% | |
| 412 | East Lindsey | £12.78 | 41.7 | 25.1% | |
| 401 | Lincoln | £13.18 | 40.5 | 21.3% | |
| 242 | North Kesteven | £15.64 | 35.7 | 6.9% | |
| 382 | South Holland | £13.91 | 39.6 | 18.7% | |
| 282 | South Kesteven | £15.07 | 36.5 | 9.5% | |
| 234 | West Lindsey | £15.68 | 35.4 | 6.0% | |
| 231 | Northamptonshire | £15.59 | 35.3 | 5.8% | |
| 411 | Corby | £12.97 | 41.5 | 24.3% | |
| 163 | Daventry | £16.76 | 33.5 | 0.3% | |
| 124 | East Northamptonshire | £17.61 | 32.0 | -4.0% | |
| 189 | Kettering | £16.17 | 34.5 | 3.4% | |
| 254 | Northampton | £15.43 | 35.9 | 7.7% | |
| 101 | South Northamptonshire | £18.12 | 31.1 | -6.7% | |
| 399 | Wellingborough | £13.53 | 40.4 | 21.1% | |
| 194 | Nottinghamshire | £16.05 | 34.5 | 3.5% | |
| 347 | Ashfield | £14.27 | 38.3 | 14.9% | |
| 334 | Bassetlaw | £14.42 | 37.9 | 13.7% | |
| 149 | Broxtowe | £17.19 | 32.8 | -1.6% | |
| 168 | Gedling | £16.55 | 33.7 | 1.0% | |
| 414 | Mansfield | £12.49 | 42.3 | 26.7% | |
| 227 | Newark and Sherwood | £15.64 | 35.2 | 5.5% | |
| 31 | Rushcliffe | £21.33 | 26.9 | -19.2% | |
| West Midlands | £15.58 | 35.6 | 6.7% | ||
| 357 | Herefordshire | £14.07 | 38.6 | 15.6% | |
| 404 | Stoke-on-Trent | £13.34 | 40.7 | 21.9% | |
| 359 | Telford and Wrekin | £14.04 | 38.6 | 15.8% | |
| 224 | Shropshire | £15.69 | 35.1 | 5.2% | |
| 241 | Staffordshire | £15.57 | 35.6 | 6.7% | |
| 362 | Cannock Chase | £14.10 | 38.8 | 16.2% | |
| 307 | East Staffordshire | £14.78 | 37.3 | 11.7% | |
| 65 | Lichfield | £19.55 | 29.3 | -12.3% | |
| 378 | Newcastle-under-Lyme | £13.86 | 39.2 | 17.3% | |
| 147 | South Staffordshire | £17.22 | 32.8 | -1.8% | |
| 215 | Stafford | £15.96 | 35.0 | 4.8% | |
| 290 | Staffordshire Moorlands | £14.99 | 36.7 | 10.1% | |
| 355 | Tamworth | £14.18 | 38.6 | 15.6% | |
| 104 | Warwickshire | £17.92 | 31.5 | -5.6% | |
| 217 | North Warwickshire | £15.95 | 35.0 | 4.8% | |
| 312 | Nuneaton and Bedworth | £14.64 | 37.4 | 11.9% | |
| 135 | Rugby | £17.45 | 32.5 | -2.6% | |
| 51 | Stratford-on-Avon | £20.16 | 28.5 | -14.6% | |
| 53 | Warwick | £20.11 | 28.6 | -14.3% | |
| 245 | West Midlands Met County | £15.42 | 35.7 | 7.0% | |
| 261 | Birmingham | £15.28 | 36.0 | 8.0% | |
| 238 | Coventry | £15.59 | 35.6 | 6.6% | |
| 305 | Dudley | £14.81 | 37.2 | 11.5% | |
| 188 | Sandwell | £16.28 | 34.5 | 3.3% | |
| 69 | Solihull | £19.29 | 29.5 | -11.5% | |
| 363 | Walsall | £13.86 | 38.8 | 16.4% | |
| 381 | Wolverhampton | £13.72 | 39.6 | 18.5% | |
| 229 | Worcestershire | £15.63 | 35.2 | 5.6% | |
| 90 | Bromsgrove | £18.47 | 30.5 | -8.5% | |
| 167 | Malvern Hills | £16.38 | 33.6 | 0.8% | |
| 397 | Redditch | £13.44 | 40.4 | 21.0% | |
| 257 | Worcester | £15.30 | 36.0 | 7.9% | |
| 199 | Wychavon | £15.91 | 34.6 | 3.8% | |
| 321 | Wyre Forest | £14.47 | 37.5 | 12.4% | |
| East | £17.56 | 32.1 | -3.8% | ||
| 284 | Luton | £14.94 | 36.6 | 9.7% | |
| 374 | Peterborough | £14.01 | 39.0 | 17.0% | |
| 119 | Southend-on-Sea | £17.57 | 31.9 | -4.3% | |
| 184 | Thurrock | £16.24 | 34.4 | 3.0% | |
| 159 | Bedford | £16.86 | 33.3 | -0.3% | |
| 115 | Central Bedfordshire | £17.73 | 31.8 | -4.6% | |
| 97 | Cambridgeshire | £18.39 | 30.8 | -7.6% | |
| 60 | Cambridge | £19.68 | 29.1 | -12.8% | |
| 113 | East Cambridgeshire | £17.75 | 31.8 | -4.7% | |
| 369 | Fenland | £14.06 | 38.9 | 16.6% | |
| 161 | Huntingdonshire | £16.84 | 33.3 | -0.1% | |
| 25 | South Cambridgeshire | £22.31 | 26.1 | -21.9% | |
| 98 | Essex | £18.15 | 31.1 | -6.8% | |
| 129 | Basildon | £17.46 | 32.3 | -3.2% | |
| 137 | Braintree | £17.34 | 32.5 | -2.5% | |
| 13 | Brentwood | £23.33 | 25.1 | -24.8% | |
| 99 | Castle Point | £18.05 | 31.1 | -6.8% | |
| 84 | Chelmsford | £18.71 | 30.3 | -9.2% | |
| 141 | Colchester | £17.09 | 32.6 | -2.2% | |
| 78 | Epping Forest | £19.09 | 29.8 | -10.6% | |
| 246 | Harlow | £15.60 | 35.8 | 7.2% | |
| 68 | Maldon | £19.30 | 29.5 | -11.5% | |
| 76 | Rochford | £19.08 | 29.7 | -10.9% | |
| 270 | Tendring | £14.99 | 36.2 | 8.5% | |
| 35 | Uttlesford | £21.41 | 27.2 | -18.3% | |
| 43 | Hertfordshire | £20.71 | 27.9 | -16.5% | |
| 88 | Broxbourne | £18.67 | 30.5 | -8.5% | |
| 57 | Dacorum | £19.85 | 28.8 | -13.6% | |
| 19 | East Hertfordshire | £22.83 | 25.6 | -23.4% | |
| 48 | Hertsmere | £20.47 | 28.3 | -15.2% | |
| 79 | North Hertfordshire | £18.97 | 29.9 | -10.4% | |
| 3 | St Albans | £28.06 | 21.0 | -37.1% | |
| 151 | Stevenage | £17.02 | 33.0 | -1.2% | |
| 37 | Three Rivers | £20.92 | 27.6 | -17.3% | |
| 108 | Watford | £17.95 | 31.6 | -5.3% | |
| 114 | Welwyn Hatfield | £17.64 | 31.8 | -4.7% | |
| 338 | Norfolk | £14.21 | 38.2 | 14.4% | |
| 409 | Breckland | £13.07 | 41.2 | 23.4% | |
| 267 | Broadland | £15.01 | 36.2 | 8.3% | |
| 406 | Great Yarmouth | £13.08 | 40.8 | 22.2% | |
| 396 | King's Lynn and West Norfolk | £13.34 | 40.3 | 20.9% | |
| 410 | North Norfolk | £12.88 | 41.4 | 24.1% | |
| 329 | Norwich | £14.39 | 37.7 | 13.0% | |
| 166 | South Norfolk | £16.60 | 33.6 | 0.7% | |
| 219 | Suffolk | £15.84 | 35.0 | 4.9% | |
| 74 | Babergh | £19.30 | 29.7 | -11.1% | |
| 277 | Forest Heath | £15.22 | 36.4 | 9.2% | |
| 318 | Ipswich | £14.59 | 37.5 | 12.3% | |
| 228 | Mid Suffolk | £15.74 | 35.2 | 5.6% | |
| 144 | St Edmundsbury | £17.24 | 32.7 | -1.9% | |
| 198 | Suffolk Coastal | £16.12 | 34.6 | 3.7% | |
| 384 | Waveney | £13.41 | 39.8 | 19.2% | |
| London | £20.94 | 27.7 | -17.0% | ||
| 23 | Inner London | £22.80 | 25.7 | -23.1% | |
| 63 | Outer London | £19.62 | 29.2 | -12.6% | |
| 1 | Kensington and Chelsea | £35.97 | 16.4 | -50.9% | |
| 2 | Westminster | £30.37 | 19.4 | -41.9% | |
| 4 | City of London | £27.85 | 21.1 | -36.6% | |
| 5 | Richmond upon Thames | £27.39 | 21.5 | -35.6% | |
| 6 | Wandsworth | £26.09 | 22.6 | -32.4% | |
| 7 | Hammersmith and Fulham | £25.87 | 22.8 | -31.8% | |
| 8 | Camden | £25.61 | 23.0 | -31.1% | |
| 10 | Islington | £24.77 | 23.8 | -28.8% | |
| 15 | Tower Hamlets | £23.27 | 25.3 | -24.2% | |
| 17 | Bromley | £22.90 | 25.5 | -23.7% | |
| 24 | Merton | £22.62 | 25.9 | -22.5% | |
| 29 | Kingston upon Thames | £21.75 | 26.7 | -19.9% | |
| 38 | Lambeth | £21.07 | 27.6 | -17.3% | |
| 41 | Barnet | £20.68 | 27.8 | -16.7% | |
| 45 | Greenwich | £20.71 | 28.0 | -16.2% | |
| 46 | Southwark | £20.57 | 28.1 | -15.9% | |
| 56 | Hackney | £19.90 | 28.8 | -13.8% | |
| 58 | Harrow | £19.83 | 28.9 | -13.5% | |
| 62 | Haringey | £19.63 | 29.2 | -12.6% | |
| 64 | Ealing | £19.56 | 29.3 | -12.3% | |
| 67 | Redbridge | £19.40 | 29.5 | -11.6% | |
| 70 | Sutton | £19.26 | 29.6 | -11.3% | |
| 72 | Havering | £19.25 | 29.6 | -11.3% | |
| 75 | Lewisham | £19.28 | 29.7 | -11.0% | |
| 86 | Croydon | £18.69 | 30.5 | -8.6% | |
| 87 | Bexley | £18.68 | 30.5 | -8.6% | |
| 91 | Hounslow | £18.67 | 30.7 | -8.1% | |
| 106 | Waltham Forest | £18.01 | 31.5 | -5.6% | |
| 121 | Enfield | £17.56 | 32.0 | -4.2% | |
| 143 | Brent | £17.25 | 32.7 | -2.0% | |
| 156 | Hillingdon | £16.98 | 33.2 | -0.4% | |
| 218 | Newham | £15.94 | 35.0 | 4.9% | |
| 298 | Barking and Dagenham | £14.87 | 37.0 | 11.0% | |
| South East | £18.33 | 30.9 | -7.4% | ||
| 123 | Bracknell Forest | £17.72 | 32.0 | -4.1% | |
| 116 | Brighton and Hove | £17.52 | 31.8 | -4.6% | |
| 371 | Isle of Wight | £13.79 | 39.0 | 17.0% | |
| 186 | Medway | £16.21 | 34.4 | 3.1% | |
| 131 | Milton Keynes | £17.43 | 32.4 | -3.0% | |
| 326 | Portsmouth | £14.43 | 37.6 | 12.7% | |
| 100 | Reading | £18.24 | 31.1 | -6.8% | |
| 237 | Slough | £15.72 | 35.5 | 6.4% | |
| 348 | Southampton | £14.15 | 38.3 | 14.9% | |
| 71 | West Berkshire | £19.34 | 29.6 | -11.3% | |
| 21 | Windsor and Maidenhead | £22.78 | 25.6 | -23.3% | |
| 27 | Wokingham | £21.98 | 26.4 | -20.7% | |
| 40 | Buckinghamshire | £20.77 | 27.8 | -16.7% | |
| 82 | Aylesbury Vale | £18.90 | 30.1 | -9.7% | |
| 16 | Chiltern | £22.98 | 25.4 | -23.9% | |
| 12 | South Bucks | £24.24 | 24.3 | -27.2% | |
| 42 | Wycombe | £20.65 | 27.8 | -16.6% | |
| 214 | East Sussex | £15.76 | 34.9 | 4.7% | |
| 293 | Eastbourne | £14.83 | 36.9 | 10.5% | |
| 390 | Hastings | £13.41 | 40.1 | 20.3% | |
| 196 | Lewes | £15.81 | 34.6 | 3.7% | |
| 164 | Rother | £16.41 | 33.6 | 0.6% | |
| 122 | Wealden | £17.54 | 32.0 | -4.1% | |
| 85 | Hampshire | £18.70 | 30.3 | -9.1% | |
| 80 | Basingstoke and Deane | £18.97 | 30.0 | -10.0% | |
| 34 | East Hampshire | £21.31 | 27.2 | -18.5% | |
| 145 | Eastleigh | £17.13 | 32.8 | -1.8% | |
| 50 | Fareham | £20.08 | 28.5 | -14.6% | |
| 273 | Gosport | £14.94 | 36.3 | 8.9% | |
| 36 | Hart | £20.95 | 27.5 | -17.4% | |
| 202 | Havant | £16.00 | 34.7 | 3.9% | |
| 181 | New Forest | £16.14 | 34.4 | 3.0% | |
| 127 | Rushmoor | £17.62 | 32.2 | -3.6% | |
| 81 | Test Valley | £18.77 | 30.1 | -9.9% | |
| 11 | Winchester | £24.48 | 23.8 | -28.6% | |
| 136 | Kent | £17.26 | 32.5 | -2.6% | |
| 212 | Ashford | £16.07 | 34.9 | 4.6% | |
| 139 | Canterbury | £17.02 | 32.6 | -2.4% | |
| 109 | Dartford | £17.91 | 31.7 | -5.1% | |
| 260 | Dover | £15.39 | 36.0 | 8.0% | |
| 157 | Gravesham | £16.78 | 33.2 | -0.4% | |
| 112 | Maidstone | £17.66 | 31.8 | -4.8% | |
| 49 | Sevenoaks | £20.18 | 28.4 | -15.0% | |
| 255 | Folkestone and Hythe | £15.31 | 36.0 | 7.8% | |
| 190 | Swale | £16.17 | 34.5 | 3.4% | |
| 327 | Thanet | £14.42 | 37.6 | 12.8% | |
| 59 | Tonbridge and Malling | £19.78 | 28.9 | -13.3% | |
| 55 | Tunbridge Wells | £19.94 | 28.7 | -14.0% | |
| 93 | Oxfordshire | £18.42 | 30.8 | -7.7% | |
| 155 | Cherwell | £16.91 | 33.2 | -0.6% | |
| 120 | Oxford | £17.57 | 31.9 | -4.3% | |
| 30 | South Oxfordshire | £21.61 | 26.8 | -19.7% | |
| 77 | Vale of White Horse | £19.09 | 29.8 | -10.6% | |
| 134 | West Oxfordshire | £17.17 | 32.5 | -2.6% | |
| 28 | Surrey | £21.77 | 26.6 | -20.3% | |
| 9 | Elmbridge | £25.55 | 23.0 | -30.9% | |
| 20 | Epsom and Ewell | £22.73 | 25.6 | -23.3% | |
| 18 | Guildford | £22.79 | 25.5 | -23.5% | |
| 33 | Mole Valley | £21.38 | 27.0 | -19.1% | |
| 39 | Reigate and Banstead | £20.94 | 27.8 | -16.8% | |
| 52 | Runnymede | £20.21 | 28.6 | -14.4% | |
| 125 | Spelthorne | £17.60 | 32.1 | -3.9% | |
| 26 | Surrey Heath | £22.12 | 26.4 | -21.0% | |
| 32 | Tandridge | £21.49 | 27.0 | -19.2% | |
| 14 | Waverley | £23.16 | 25.2 | -24.5% | |
| 44 | Woking | £20.49 | 27.9 | -16.3% | |
| 130 | West Sussex | £17.34 | 32.4 | -3.0% | |
| 191 | Adur | £15.95 | 34.5 | 3.5% | |
| 239 | Arun | £15.48 | 35.6 | 6.6% | |
| 111 | Chichester | £17.57 | 31.8 | -4.8% | |
| 236 | Crawley | £15.66 | 35.4 | 6.1% | |
| 61 | Horsham | £19.65 | 29.1 | -12.7% | |
| 83 | Mid Sussex | £18.77 | 30.2 | -9.5% | |
| 148 | Worthing | £17.12 | 32.8 | -1.8% | |
| South West | £15.80 | 35.3 | 5.8% | ||
| 96 | Bath and North East Somerset | £18.10 | 30.8 | -7.6% | |
| 192 | Bournemouth | £15.95 | 34.5 | 3.5% | |
| 178 | Bristol, City of | £16.20 | 34.2 | 2.6% | |
| 154 | North Somerset | £16.74 | 33.1 | -0.7% | |
| 376 | Plymouth | £13.90 | 39.0 | 17.0% | |
| 179 | Poole | £16.16 | 34.3 | 2.8% | |
| 206 | South Gloucestershire | £15.94 | 34.8 | 4.2% | |
| 213 | Swindon | £15.97 | 34.9 | 4.7% | |
| 393 | Torbay | £13.12 | 40.2 | 20.6% | |
| 387 | Cornwall | £13.34 | 40.0 | 19.8% | |
| 314 | Devon | £14.40 | 37.4 | 12.0% | |
| 297 | East Devon | £14.67 | 37.0 | 10.9% | |
| 303 | Exeter | £14.60 | 37.2 | 11.4% | |
| 324 | Mid Devon | £14.46 | 37.5 | 12.5% | |
| 373 | North Devon | £13.53 | 39.0 | 17.0% | |
| 203 | South Hams | £15.77 | 34.7 | 3.9% | |
| 372 | Teignbridge | £13.79 | 39.0 | 17.0% | |
| 339 | Torridge | £14.21 | 38.2 | 14.4% | |
| 306 | West Devon | £14.45 | 37.2 | 11.6% | |
| 200 | Dorset | £15.79 | 34.6 | 3.8% | |
| 153 | Christchurch | £16.69 | 33.0 | -1.1% | |
| 103 | East Dorset | £17.91 | 31.3 | -6.1% | |
| 209 | North Dorset | £15.67 | 34.9 | 4.6% | |
| 311 | Purbeck | £14.28 | 37.3 | 11.9% | |
| 265 | West Dorset | £15.02 | 36.1 | 8.3% | |
| 302 | Weymouth and Portland | £14.61 | 37.1 | 11.3% | |
| 152 | Gloucestershire | £16.92 | 33.0 | -1.2% | |
| 94 | Cheltenham | £18.40 | 30.8 | -7.6% | |
| 89 | Cotswold | £18.48 | 30.5 | -8.5% | |
| 222 | Forest of Dean | £15.71 | 35.1 | 5.1% | |
| 322 | Gloucester | £14.58 | 37.5 | 12.4% | |
| 146 | Stroud | £17.03 | 32.8 | -1.8% | |
| 102 | Tewkesbury | £17.92 | 31.3 | -6.2% | |
| 294 | Somerset | £14.83 | 36.9 | 10.5% | |
| 187 | Mendip | £15.88 | 34.4 | 3.2% | |
| 296 | Sedgemoor | £14.79 | 37.0 | 10.8% | |
| 333 | South Somerset | £14.31 | 37.9 | 13.6% | |
| 281 | Taunton Deane | £14.97 | 36.5 | 9.5% | |
| 379 | West Somerset | £13.47 | 39.2 | 17.5% | |
| 150 | Wiltshire | £16.94 | 32.9 | -1.3% | |
| Wales | £14.64 | 37.4 | 11.9% | ||
| 366 | Isle of Anglesey / Ynys Môn | £13.96 | 38.9 | 16.5% | |
| 365 | Gwynedd / Gwynedd | £13.73 | 38.8 | 16.4% | |
| 364 | Conwy / Conwy | £13.86 | 38.8 | 16.4% | |
| 389 | Denbighshire / Sir Ddinbych | £13.17 | 40.1 | 20.2% | |
| 330 | Flintshire / Sir y Fflint | £14.47 | 37.8 | 13.3% | |
| 323 | Wrexham / Wrecsam | £14.68 | 37.5 | 12.4% | |
| 368 | Powys / Powys | £13.84 | 38.9 | 16.5% | |
| 337 | Ceredigion / Ceredigion | £14.12 | 38.1 | 14.2% | |
| 380 | Pembrokeshire / Sir Benfro | £13.66 | 39.4 | 18.1% | |
| 331 | Carmarthenshire / Sir Gaerfyrddin | £14.34 | 37.8 | 13.4% | |
| 291 | Swansea / Abertawe | £14.88 | 36.7 | 10.1% | |
| 367 | Neath Port Talbot / Castell-nedd Port Talbot | £13.96 | 38.9 | 16.5% | |
| 278 | Bridgend / Pen-y-bont ar Ogwr | £15.10 | 36.5 | 9.3% | |
| 132 | Vale of Glamorgan / Bro Morgannwg | £17.29 | 32.5 | -2.7% | |
| 225 | Cardiff / Caerdydd | £15.77 | 35.2 | 5.4% | |
| 351 | Rhondda Cynon Taf / Rhondda Cynon Taf | £14.09 | 38.5 | 15.4% | |
| 391 | Merthyr Tydfil / Merthyr Tudful | £13.41 | 40.1 | 20.3% | |
| 370 | Caerphilly / Caerffili | £13.95 | 38.9 | 16.6% | |
| 413 | Blaenau Gwent / Blaenau Gwent | £12.64 | 42.2 | 26.4% | |
| 301 | Torfaen / Torfaen | £14.74 | 37.1 | 11.2% | |
| 95 | Monmouthshire / Sir Fynwy | £18.40 | 30.8 | -7.6% | |
| 315 | Newport / Casnewydd | £14.63 | 37.4 | 12.0% | |
| Scotland | £16.14 | 34.4 | 3.0% | ||
| 140 | Aberdeen City | £17.22 | 32.6 | -2.3% | |
| 133 | Aberdeenshire | £17.19 | 32.5 | -2.7% | |
| 310 | Angus | £14.66 | 37.3 | 11.8% | |
| 342 | Argyll and Bute | £13.94 | 38.3 | 14.7% | |
| 352 | Clackmannanshire | £14.19 | 38.5 | 15.5% | |
| 361 | Dumfries and Galloway | £14.00 | 38.8 | 16.2% | |
| 316 | Dundee City | £14.48 | 37.5 | 12.3% | |
| 287 | East Ayrshire | £15.02 | 36.7 | 9.9% | |
| 47 | East Dunbartonshire | £20.32 | 28.2 | -15.6% | |
| 158 | East Lothian | £16.66 | 33.3 | -0.3% | |
| 22 | East Renfrewshire | £22.65 | 25.7 | -23.1% | |
| 92 | City of Edinburgh | £18.37 | 30.7 | -8.0% | |
| 249 | Falkirk | £15.38 | 35.8 | 7.3% | |
| 271 | Fife | £15.21 | 36.2 | 8.5% | |
| 201 | Glasgow City | £15.90 | 34.6 | 3.8% | |
| 279 | Highland | £14.99 | 36.5 | 9.3% | |
| 274 | Inverclyde | £14.93 | 36.3 | 8.9% | |
| 243 | Midlothian | £15.54 | 35.7 | 6.9% | |
| 336 | Moray | £14.14 | 38.1 | 14.1% | |
| 349 | Na h-Eileanan Siar | £14.00 | 38.4 | 15.2% | |
| 256 | North Ayrshire | £15.31 | 36.0 | 7.8% | |
| 295 | North Lanarkshire | £14.91 | 36.9 | 10.7% | |
| 207 | Orkney Islands | £15.29 | 34.9 | 4.5% | |
| 170 | Perth and Kinross | £16.42 | 33.8 | 1.2% | |
| 193 | Renfrewshire | £16.05 | 34.5 | 3.5% | |
| 269 | Scottish Borders | £15.12 | 36.2 | 8.4% | |
| 138 | Shetland Islands | £17.13 | 32.6 | -2.4% | |
| 160 | South Ayrshire | £16.76 | 33.3 | -0.2% | |
| 177 | South Lanarkshire | £16.22 | 34.2 | 2.4% | |
| 66 | Stirling | £19.45 | 29.4 | -11.8% | |
| 353 | West Dunbartonshire | £14.19 | 38.5 | 15.5% | |
| 232 | West Lothian | £15.69 | 35.3 | 5.9% | |
| Northern Ireland | £14.59 | 37.5 | 12.3% |