The NimbleFins Inflation Guide | Rates, FAQs and Calculator
Inflation seems to be everywhere right now, with people having to pay more at the pump, to fill their grocery carts, to pay rent or homeowner expenses, and more—it seems like everything costs more now. In this article we run through the latest figures and try to display the data in a few different ways to give our readers a picture of what's really going on. Learn about inflation rates, see inflation history and see which categories have the biggest price rises.
In this article
- UK Inflation History
- Current UK Inflation Rates
- What's the real impact of inflation on household budgets?
UK Inflation History
Annual inflation (CPIH) in hit 7.8% in April 2022. Previously, the last time we saw inflation that high was 31 years ago, in 1991.
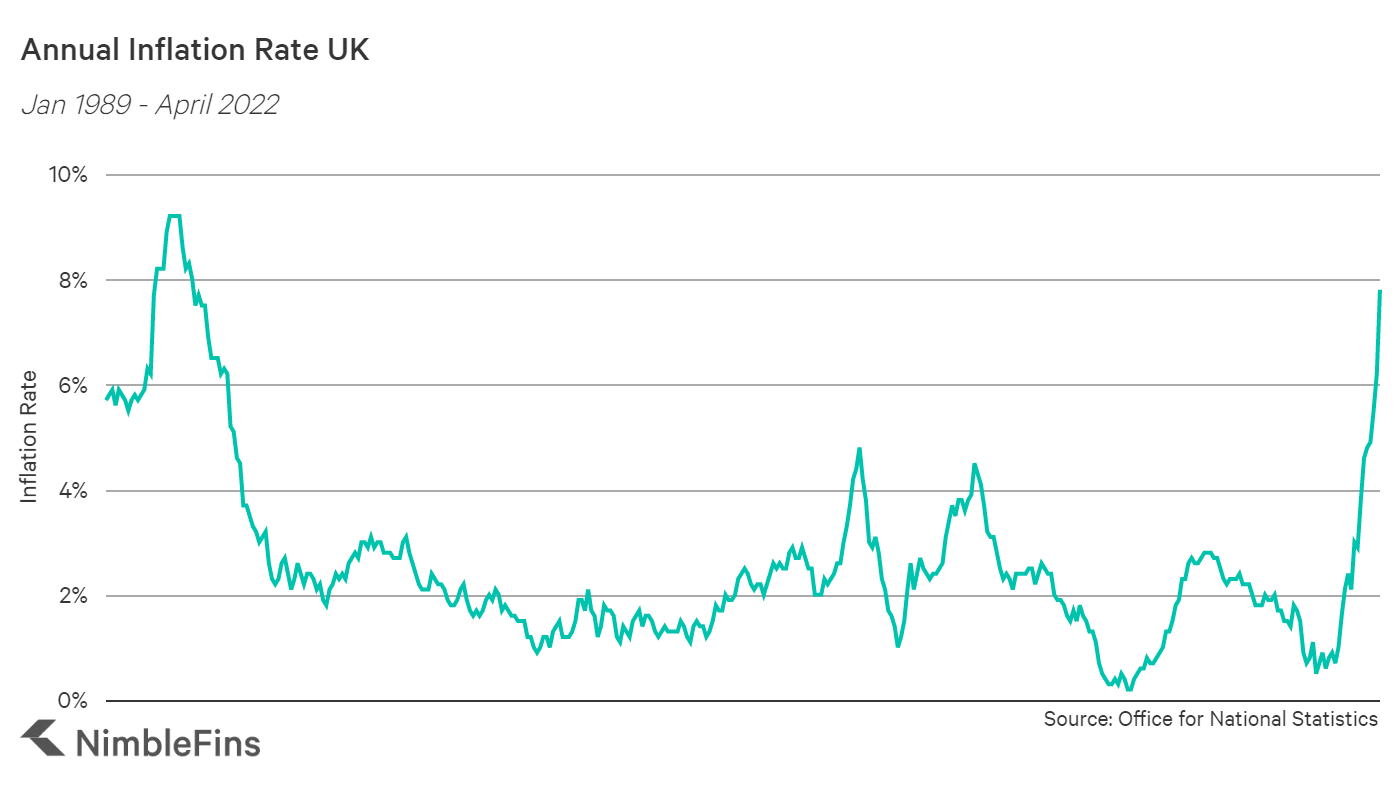
Below are annual rates since 2015, plus the annual rate for April 2022 so you can see how much the inflation rate has jumped up in 2022.
| UK Inflation Rates | Annual Rate |
|---|---|
| 2015 | 0.4% |
| 2016 | 1.0% |
| 2017 | 2.6% |
| 2018 | 2.3% |
| 2019 | 1.7% |
| 2020 | 1.0% |
| 2021 | 2.5% |
| April 2022 | 7.8% |
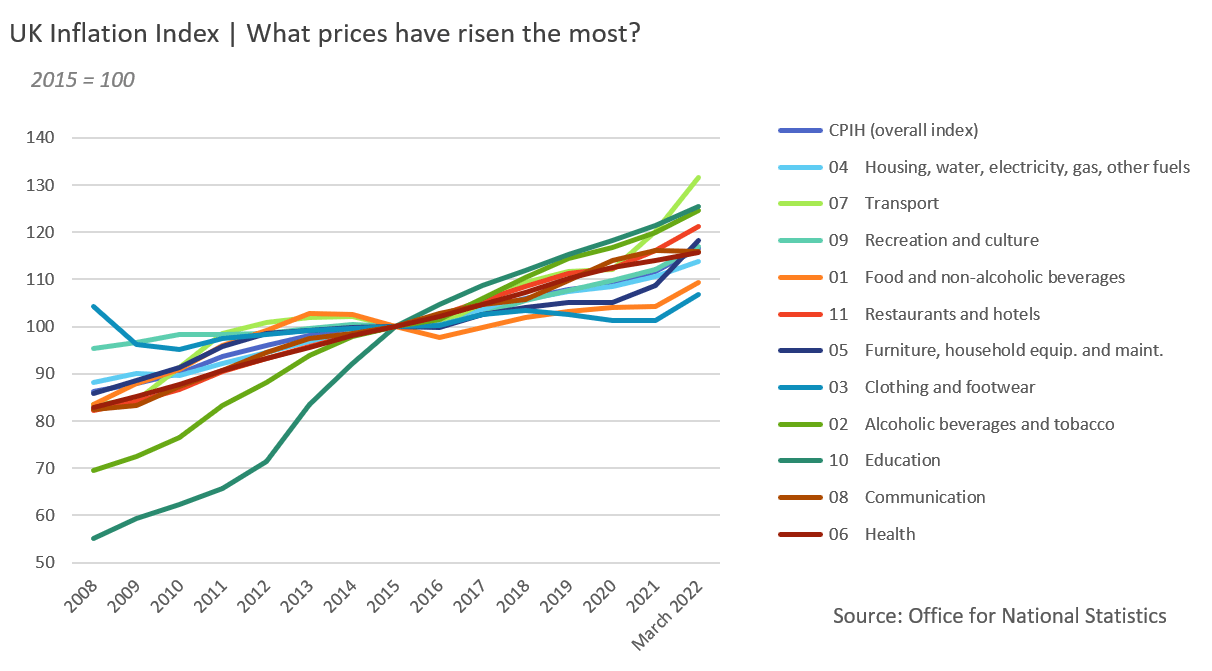
Inflation Index
The Inflation Index, which uses 2015 as a reference year, shows the history of how prices have changed over time, and is especially useful for visualising changes across different categories of household spending.
(How does an index work? A base year is chosen where the index is 100. In this case, the base year is 2015. The index values go up or down from 100, according to the mean percentage increases or decreases. A percentage increase nudges the index number above 100, and a percentage decrease drops the index number below 100. You can look forward or backward in time from the reference year.)
The chart below displays inflation history via the index from 2008 until March 2022. As you can see, transport costs have risen the most since 2015—31.5% in the past 6+ years, in fact.
Looking back to 2008, however, education costs have risen the most between then (index value of 55.5) and now (125.4).
Current Inflation Rates UK
Now let's dig into inflation rates for different areas of the household budget. Which areas are being hit the hardest? Here is a recap of inflation rates from March 2021 to March 2022. As expected from the index chart above, we can see that transport is the hardest hit broad category so far—up 13.6% in the 12-months to March 2022. This is driven by fuel/lubricant costs (+30.7%) as well as the cost of second hand cars (+31%)
While, the broad category of "Housing, water, electricity, gas and other fuels" is only up 4.6% in the past 12 months, digging deeper into the subcategories we see that gas and electric for homes is up a huge amount—28.3% and 19.2%, respectively.
| Inflation Rate | 12-month change to March 2022 | |
|---|---|---|
| CPIH (overall index) | 6.2% | |
| Transport | 13.6% | |
| Fuels and lubricants | 30.7% | |
| New cars | 3.8% | |
| Second hand cars | 31.0% | |
| Motorcycles and bicycles | 9.4% | |
| Furniture, household equipment and maintenance | 10.4% | |
| Furniture and furnishings | 16.8% | |
| Glassware, tableware and household utensils | 11.3% | |
| Clothing and footwear | 9.7% | |
| Restaurants and hotels | 6.9% | |
| Restaurants & cafes | 6.0% | |
| Accommodation services | 11.0% | |
| Food and non-alcoholic beverages | 5.9% | |
| Recreation and culture | 5.0% | |
| Alcoholic beverages and tobacco | 4.8% | |
| Housing, water, electricity, gas and other fuels | 4.6% | |
| Electricity | 19.2% | |
| Gas | 28.3% | |
| Education | 4.5% | |
| Health | 2.5% | |
| Communication | 0.7% | |
We get into more detail for some of these broad budget categories below.
Transport
Cost-of-living increases for transport-related spending are primarily due to rises in fuel costs and rises in the costs of used cars. With new car sales being impacted by longer new car delivery times, prices in the used car market are around 31% more on used cars now than a year ago.

Housing
Rents and housing ownership costs are up 2.4% and 2.7% respectively—while these may seem like more reasonable numbers relative to other figures mentioned here, given that rent/homeowner costs are such a large proportion of the typical household's expenditures, a small-ish percentage increase of a large absolute number means a big impact for the typical household. Added to that, there is the huge uptick in energy prices—gas up 28.3%, electricity up 19.2% and liquid fuels up 113.9%.

Insurance
Household insurance costs are up as well, in particular home content insurance, which shows that the cost of home contents insurance is now 16.1% higher than a year ago.
Confusingly, the ONS inflation data shows transport insurance up with a 5.6% inflation rate, but the ABI reported that motor insurance rates had dropped to £416 for comprehensive policies in Q1 2022, which is 5% lower than the same period last year. We're not sure what to make of this conflicting data regarding the cost of motor insurance.
| Insurance Inflation | 12 months to March 2022 |
|---|---|
| 12.5 Insurance | 8.3% |
| 12.5.2 House contents insurance | 16.1% |
| 12.5.3 Health insurance | 6.1% |
| 12.5.4 Transport insurance | 5.9% |
What's the real impact of inflation on household budgets?
Inflation rates are one thing—but what's the real out-of-pocket impact on regular households? How much more money does it actually cost to live now than a year ago?
We've dug into the data from the ONS inflation calculator to see the real-world impact on different UK households. We checked those with median after-tax household income (£31,400 per year or £2,617 per month), mean after-tax household income (£37,600 per year or £3,133 per month) and a selection of other income levels for 6 other households with different income levels. Here's what we found:
| Household income (per month, after tax) | ONS estimated additional monthly costs due to inflation | Additional costs as % of income (i.e. implied inflation) |
|---|---|---|
| £1,000 | £121 | 12.1% |
| £1,500 | £159 | 10.6% |
| £2,000 | £188 | 9.4% |
| £2,617 (median) | £220 | 8.4% |
| £3,133 (mean) | £252 | 8.0% |
| £5,000 | £328 | 6.6% |
| £7,000 | £353 | 5.0% |
| £10,000 | £500 | 5.0% |
As you can see in the table above, the typical UK household with median income is facing a cost of living increase of £220 per month compared to a year ago. This figure is lower for those with less income, and higher for those with more income.
But check out the last column. It shows a figure that gives a better sense of how much a household might really feel the cost of living increases—specifically, the last column shows the cost of living increase as a proportion of household income. As you'll see, for lower-income households this proportion is significantly higher than for higher-income households. For example, the £159/month cost of living increase for households with £1,500 of income represents over 10% of their income. Where is a household supposed to come up with an extra 10% to pay for these cost rises? Add to that, the items contributing most to their cost-of-living increases are related to basic needs like rent/housing, energy, and food and drink.
As income rises, two things happen. Firstly, the cost of living increase becomes a smaller and smaller proportion of income. That makes cost of living increases easier to absorb for those earning more. For example, for households with a higher monthly income of £7,000, the cost of living increase only represents 5% of their income.
Secondly, there is a shift in which items contribute the most to cost-of-living increases—for example, where lower-income households are struggling with higher grocery bills, higher-income households with £10,000 a month of income are taking the food-related hit in the form of higher restaurant charges when eating and drinking out. And lower-income families struggle with basic needs, really feeling the impact of the energy crisis; in contrast, the larger overall budgets of higher-income households mean that the rise in energy, while surely an annoyance, is not one of the 5 items causing them the most headaches.
The table below shows, for various income levels, which 5 items are contributing the most to cost-of-living increases (and the estimated cost-of-living increase in GBP).
Biggest contributers to cost-of-living increases by monthly, a/t household income
| £1,000 income/month | £1,500 income/month | £2,000 income/month | £2,617 (median income) | £3,133 (mean income) | £5,000 income/month | £7,000 income/month | £10,000 income/month | |
|---|---|---|---|---|---|---|---|---|
| 1 | Energy bills (£19.6) | Energy bills (£20.2) | Energy bills (£22.1) | Homeowner housing costs (£22) | The purchase of vehicles (£26) | Homeowner housing costs (£38) | Homeowner housing costs (£45.2) | Homeowner housing costs (£64.1) |
| 2 | Food and drink (£13.2) | Rent (£17.8) | Homewares (£18.2) | Energy bills (£21.1) | Homeowner housing costs (£25.7) | Petrol or diesel (£36.4) | Petrol or diesel (£34.4) | Homewares (£48.5) |
| 3 | Rent (£11.5) | Food and drink (£15.6) | Petrol or diesel (£18.1) | Petrol or diesel (£21) | Petrol or diesel (£24) | Homewares (£29) | Homewares (£32.1) | The purchase of vehicles (£45.9) |
| 4 | Homewares (£10.7) | Homeowner housing costs (£13.9) | Food and drink (£17.4) | Food and drink (£19.9) | Rent (£22.3) | The purchase of vehicles (£27) | The purchase of vehicles (£28) | Petrol or diesel (£38) |
| 5 | Homeowner housing costs (£10.5) | Homewares (£13.3) | Rent (£17.1) | Homewares (£19) | Energy bills (£21.5) | Food and drink (£24.7) | Food and drink (£26.5) | Eating and drinking out (£36.5) |
Lower income households are mostly affected by energy bill rises, followed by food and drink, rent, homewares and homeowner housing costs.
The typical household (£2,617 of monthly after-tax income, which is the median figure) is mostly affected by homeowner housing costs (£22 extra per month), energy bills (£21.1), petrol/diesel (£21), food and drink (£19.9) and homewares (£19).
Since higher income families spent so much more on categories like housing, petrol/diesel, homewares, vehicle purchass and food, you'll notice that energy bill increases have a small relative impact on these households—not making the list of top 5 contributors to cost-of-living increases.
FAQs
As of March 2022, the current inflation rate in the UK was 6.2%—the highest it's been for 30 years.
Inflation is a measure of how much prices have increased. Usually, it shows the change from a year ago, so a 6% inflation rate would mean that prices are now 6% higher than they were a year ago. For example, if a tv cost £100 last year, this year it would cost £106.
In a period of higher inflation, interest rates are usually raised which has the effect of making borrowing more expensive—as a result, people borrow less and have less money to spend. This in turn can help to lower inflation rates. Interest rates are usually changed by central banks like the Bank of England in response to inflation, to keep inflation in check.
Find out the impact of inflation on your budget
Use the ONS inflation calculator below to enter your specific spending data. It will tell you your personal inflation rate, how much extra you might be out of pocket each month now compared to a year ago and identify which five items contribute the most to your cost-of-living increases.