Roads Feel More Congested Than Ever? Worst Postcodes Revealed
Residents of many areas in England struggle with road congestion and a scarcity of public parking spaces. Over the past 5 years the number of licenced cars has risen 6.8%, exacerbating the problem. While Urban areas are the worst, even rural areas are feeling the effects of more cars on the roads. Here are the worst postcodes in England—see how your area compares.
- The Worst Postcodes with the Largest Growth in Car Registrations
- Rural Areas with More Cars
- Postcodes with Fewer Cars
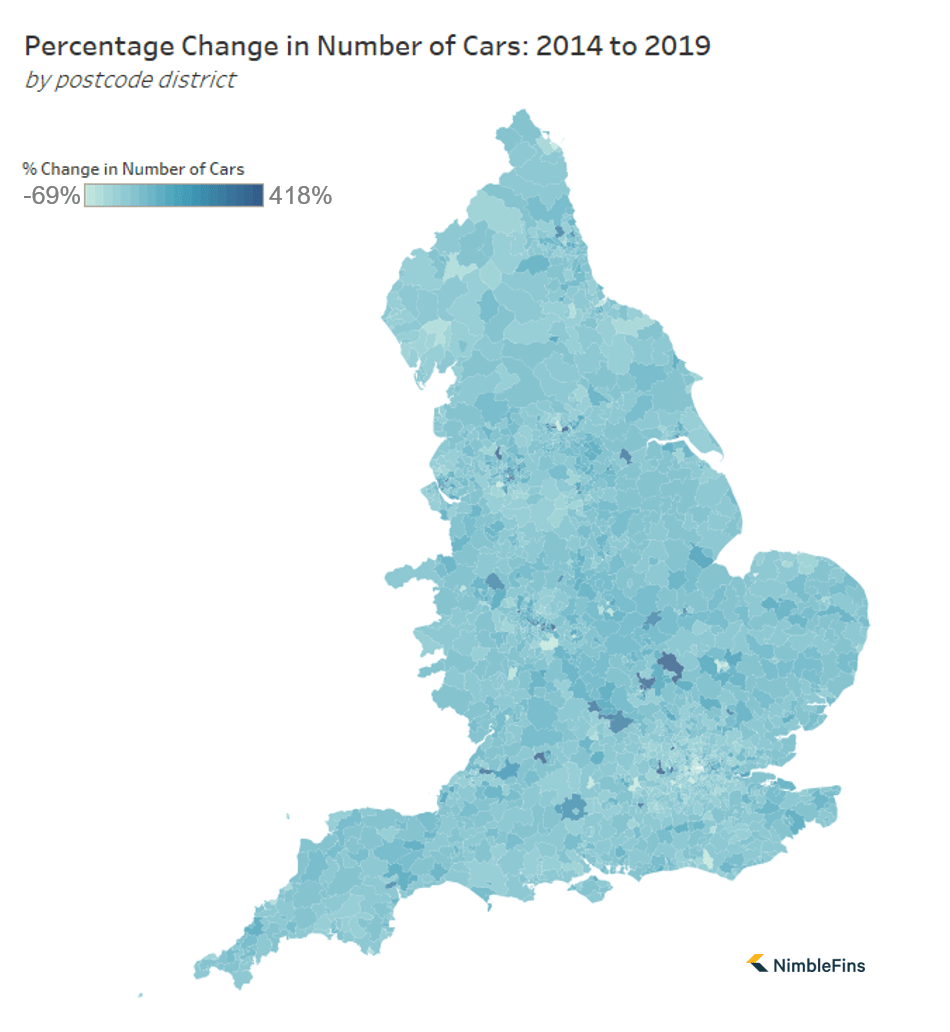
- Car Registrations by Region and Postcode
In order to find out how different areas compare, we've analysed data from the Department for Transport to find out which postcode districts had the largest increase in registered cars in the past 5 years. See the Methodology section below for a detailed description of how we generated our results.

Postcode Districts with the Biggest Growth in Licenced Cars
Not surprisingly, urban areas have generally suffered from the worst increase in the number of cars, with some areas seeing 2X, 3X or even 5X as many licenced cars in 2019 than there were 5 years ago, increasing already congested roads.
The postcode district with the largest percentage increase in number of cars was MK14—Blakelands, Conniburrow, Downs Barn, Giffard Park, Great Linford, Linford Wood, Oakridge Park, Stantonbury, Neath Hill and Redhouse Park in Milton Keynes—where the number of cars grew from 74,012 in Q2 2014 to 171,615 in Q2 2019, an increase of 97,603 cars or 131.9% over 5 years.
The SN5 postcode, which includes West Swindon, Lydiard Millicent and Purton, had an additional 53,540 cars in 2019 from 2014, a percentage increase of 62%.
Ranked by Biggest Increase in Number of Licenced Cars
| 10 Worst Areas with Biggest Increase in Number of Licenced Cars | Local Authority | Cars in Q2 2014 | Cars in Q2 2019 | Change | % Change | |
|---|---|---|---|---|---|---|
| 1 | MK14 | Milton Keynes | 74,012 | 171,615 | 97,603 | 131.9% |
| 2 | SN5 | Bedford, Huntingdonshire | 86,423 | 139,963 | 53,540 | 62.0% |
| 3 | B26 | Sheldon and Yardley in Birmingham | 207,447 | 258,332 | 50,885 | 24.5% |
| 4 | BS16 | Bristol, South Gloucestershire | 104,292 | 135,401 | 31,109 | 29.8% |
| 5 | GU11 | Aldershot | 64,376 | 83,635 | 19,259 | 29.9% |
| 6 | BL8 | Bury | 23,069 | 34,702 | 11,633 | 50.4% |
| 7 | SL1 | South Bucks, Slough | 124,681 | 135,764 | 11,083 | 8.9% |
| 8 | SL3 | Slough, South Bucks, Windsor and Maidenhead | 24,961 | 33,766 | 8,805 | 35.3% |
| 9 | MK44 | Bedford, Huntingdonshire | 17,297 | 25,569 | 8,272 | 47.8% |
| 10 | WD18 | Watford | 18,870 | 26,801 | 7,931 | 42.0% |
While most areas with a large increase in cars are mostly urban, MK44 was the only postcode district in the top 10 that is significantly rural.
The postcode with the biggest percentage increase in cars was E20 in London, which covers the Olympic Park and parts of Stratford, Homerton, Leyton and Bow across Newham, Waltham Forest, Hackney and Tower Hamlets. In E20, there was a massive 418% increase in licenced cars from 2014 to 2019. However, the actual number of cars is relatively small so E20 didn't make the top 10 list—the number of cars rose from 150 in 2014 to 777 in 2019, an increase of 627 cars.
Ranked by Biggest Percentage Change in Licenced Cars
| 10 Worst Areas with Biggest Percentage Change in Licenced Cars | Local Authority | Cars in Q2 2014 | Cars in Q2 2019 | Change | % Change | |
|---|---|---|---|---|---|---|
| 1 | E20 | Newham, Waltham Forest, Hackney and Tower Hamlets | 150 | 777 | 627 | 418% |
| 2 | MK1 | Milton Keynes | 1,198 | 4,084 | 2,886 | 241% |
| 3 | MK14 | Milton Keynes | 74,012 | 171,615 | 97,603 | 132% |
| 4 | SN5 | Swindon | 86,423 | 139,963 | 53,540 | 62% |
| 5 | SW1W | Westminster and Kensington and Chelsea | 2,499 | 3,801 | 1,302 | 52% |
| 6 | BD1 | Bradford | 1,073 | 1,626 | 553 | 52% |
| 7 | BL8 | Bury | 23,069 | 34,702 | 11,633 | 50% |
| 8 | MK44 | Bedford and Huntingdonshire | 17,297 | 25,569 | 8,272 | 48% |
| 9 | WD18 | Watford | 18,870 | 26,801 | 7,931 | 42% |
| 10 | B37 | Solihull | 13,205 | 18,322 | 5,117 | 39% |
Rural Postcode Districts with the Biggest Percentage Change in Cars
While urban areas dominate the top ten worst postcode districts, many rural areas also have to contend with more cars now. Even if the actual number of cars is lower, this can be a struggle as roads in small towns are often not equipped to provide necessary parking or handle heavier traffic flows. To capture these effects, we analysed the percentage change in cars in postcodes that are significantly rural.
CM24, covering Stansted Mountfitchet and Stansted Airport in Uttlesford, was the rural area with the biggest % change in cars, growing from 4,723 cars in 2014 to 5,893 cars in 2019, a 24.8% increase. Hemel Hempstead postcode district HP18, which includes parts of Aylesbury Vale, was close behind with a 23.8% increase.
| 10 Rural Postcodes with Biggest % Car Increase | Local Authority | Cars in Q3 2014 | Cars in Q2 2019 | % Change | |
|---|---|---|---|---|---|
| 1 | CM24 | Uttlesford | 4,723 | 5,893 | 24.8% |
| 2 | HP18 | Aylesbury Vale | 9,815 | 12,148 | 23.8% |
| 3 | SP11 | Test Valley, Wilstshire and Basingstoke and Deane | 15,288 | 18,366 | 20.1% |
| 4 | SN14 | Wiltshire and South Gloucestershire | 16,844 | 20,040 | 19.0% |
| 5 | SP9 | Wiltshire and Test Valley | 3,940 | 4,624 | 17.4% |
| 6 | DL9 | North Yorkshire | 5,006 | 5,821 | 16.3% |
| 7 | ME11 | Swale | 1,456 | 1,686 | 15.8% |
| 8 | B50 | Stratford-on-Avon | 3,392 | 3,904 | 15.1% |
| 9 | PO32 | Isle of Wight | 3,896 | 4,484 | 15.1% |
| 10 | CB25 | South Cambridgeshire, East Cambridgeshire | 9,265 | 10,634 | 14.8% |
Rounding out the top ten rural areas were SP11 (parts of Test Valley, Basingstoke and Deane, Wiltshire surrounding Andover), SN14 (parts of Chippenham), SP9 (Tidworth and Shipton Bellinger in Wiltshire and Test Valley), DL9 (Catterick Garrison in North Yorkshire), ME11 (Queenborough and Rushenden in Swale), B50(Bidford-on-Avon in Straford-upon-Avon), PO32 (East Cowes and Whippingham on the Isle of Wight) and CB25 (parts of South Cambridgeshire and East Cambridgeshire).
Postcode Districts with Fewer Cars
While 9.3 out of 10 postcode districts have more licenced cars now than five years ago, there are some areas with fewer cars now than before. Two areas in Solihull, Birmingham, B93 and B94, have around 60% fewer licenced cars than they did in 2014. Also, two postcodes in Reading made the top ten list for areas with fewer cars now: there are 22,902 fewer cars in RG14 and 5,785 fewer cars in RG40.
| Areas with Fewer Cars | Local Authority | Cars in Q3 2014 | Cars in Q2 2019 | Change | % Change | |
|---|---|---|---|---|---|---|
| 1 | B93 | Solihull | 40,843 | 17,257 | -23,586 | -57.7% |
| 2 | LS28 | Leeds | 42,730 | 19,828 | -22,902 | -53.6% |
| 3 | RG14 | West Berkshire | 47,154 | 25,354 | -21,800 | -46.2% |
| 4 | M33 | Trafford and Manchester | 51,662 | 30,176 | -21,486 | -41.6% |
| 5 | GL1 | Gloucester | 31,442 | 15,469 | -15,973 | -50.8% |
| 6 | B94 | Solihull | 17,777 | 5,496 | -12,281 | -69.1% |
| 7 | RG40 | Wokingham and Bracknell Forest | 24,273 | 18,488 | -5,785 | -23.8% |
| 8 | CV1 | Coventry | 12,385 | 6,880 | -5,505 | -44.4% |
| 9 | NW1 | Camden and Westminster | 14,161 | 9,353 | -4,808 | -34.0% |
| 10 | WR5 | Worcester, Wychavon and Malvern Hills | 32,477 | 30,363 | -2,114 | -6.5% |
Number of Licenced Cars in All Postcode Districts by Region
The region with the biggest actual increase in licenced cars from 2014 to 2019 was the South East—364,918 additional cars hit the roads over the past five years, bringing the total number of licenced cars to 5,194,646.
The region with the biggest percentage increase in licenced cars from 2014 to 2019 was the South West, where there are now 8.7% more cars than five years ago.
| Region | Cars in Q2 2014 | Cars in Q2 2019 | Change | % Change |
|---|---|---|---|---|
| South East | 4,829,728 | 5,194,646 | 364,918 | 7.6% |
| South West | 2,954,541 | 3,212,914 | 258,373 | 8.7% |
| East of England | 3,121,128 | 3,336,134 | 215,006 | 6.9% |
| West Midlands | 2,851,950 | 3,055,252 | 203,302 | 7.1% |
| North West | 3,067,986 | 3,264,738 | 196,752 | 6.4% |
| East Midlands | 2,280,687 | 2,456,963 | 176,276 | 7.7% |
| Yorkshire and The Humber | 2,297,358 | 2,441,206 | 143,848 | 6.3% |
| London | 2,579,987 | 2,656,785 | 76,798 | 3.0% |
| North East | 1,071,598 | 1,139,466 | 67,868 | 6.3% |
To see detailed data for each region, or to look up data for a specific postcode, see the individual car licence pages for each region:
Methodology
To determine which areas have many more cars than they did 5 years ago, we analysed data from the Department for Transport on licenced cars in each postcode district in England. We excluded postcode districts with fewer than 100 cars in 2019, because the data for areas with too few cars is not statistically as reliable. To determine which postcode districts are rural or urban, we used postcode classifications from Gov.uk.