State pension rise over time - how much is State Pension?
Key takeaways
- The State Pension is currently £230.25 a week (£11,973 a year).
- Since the new State Pension launched in 2016, payments have risen by 48%.
- The average full-time salary is about £34,000.
- Without the triple lock we estimate the 2025 State Pension could sit at about £181.59.
The triple lock is under scrutiny once again, and questions remain about whether the Government can afford to keep increasing pensions at the current pace.
Using official data and NimbleFins analysis, we look at how the State Pension has changed over time, how it compares to average earnings, and what pensioners would be receiving today if the triple lock had never existed.
What is the State Pension?
The State Pension is a weekly payment paid by the Government to people who reach State Pension age and have built up enough National Insurance contributions or credits.
There are two types of State Pension:
- New State Pension – for people reaching pension age on or after April 2016
- Basic State Pension – for those who reached pension age before April 2016
This article focuses on the new State Pension, which has been in place since April 2016 and currently pays the highest rates.
How much is the State Pension?
In the 2025/26 tax year, the full new State Pension is:
£230.25 a week (£11,973 a year).
This figure is set using the triple lock, which increases the pension each April by whichever is highest of:
- Average earnings growth
- Price inflation (CPI)
- 2.5% minimum guarantee
In April 2024, the State Pension rose by 8.5%, driven by strong wage growth the previous year. That increase added around £900 a year to the income of full new State Pension recipients. It rose again in 2025 by 4.1%, giving pensioners a £470 increase.
The exact rise for April 2026 will be confirmed in the Autumn Budget.
State Pension change over time
Here’s how the full new State Pension has risen since it was introduced in April 2016:
| Year | Up-rating percentage | Basis for up-rating | Weekly pension | Annual pension |
|---|---|---|---|---|
| Apr-16 | 2.9% | Earnings Growth | £155.65 | £8,093.80 |
| Apr-17 | 2.5% | 2.5% Minimum | £159.55 | £8,296.60 |
| Apr-18 | 3.0% | Price Inflation (CPI) | £164.35 | £8,545.20 |
| Apr-19 | 2.6% | Earnings Growth | £168.60 | £8,767.20 |
| Apr-20 | 3.9% | Earnings Growth | £175.20 | £9,110.40 |
| Apr-21 | 2.5% | 2.5% Minimum | £179.60 | £9,339.20 |
| Apr-22 | 3.1% | Price Inflation (CPI)* | £185.15 | £9,627.80 |
| Apr-23 | 10.1% | Price Inflation (CPI) | £203.85 | £10,600.20 |
| Apr-24 | 8.5% | Earnings Growth | £221.20 | £11,502.40 |
| Apr-25 | 4.1% | Earnings Growth | £230.25 | £11,973.00 |
Between 2016 and 2025, the full new State Pension has risen by 48%, far outpacing both inflation and average wage growth over the same period.
State Pension compared to average salary
Despite strong rises, the State Pension remains modest when compared to typical earnings.
The average full-time UK salary is about £34,000. The new State Pension (£11,973) is roughly one-third of that amount.
This means most retirees rely on additional workplace and private pensions to maintain their standard of living.
However, the triple lock has helped older people avoid real-terms income losses, and over the last decade has risen higher than the average earnings growth.

What if the Government didn’t use the triple lock?
NimbleFins has modelled how the pension would have grown since 2016 if the Government had used only one of the three triple-lock components each year:
- A flat 2.5% rise
- Inflation (CPI) each year
- Earnings growth each year
- And if the Government used the lowest of the three figures, rather than the highest.
The results are striking.
State Pension triple lock alternatives
| Year | Max rise (triple lock) | Price inflation | 2.5% rise | Earnings growth | Minimum of the 3 |
|---|---|---|---|---|---|
| Apr 2016 | £155.65 | £155.65 | £155.65 | £155.65 | £155.65 |
| Apr 2017 | £159.55 | £157.21 | £159.55 | £159.39 | £156.82 |
| Apr 2018 | £164.35 | £161.92 | £163.53 | £163.05 | £160.82 |
| Apr 2019 | £168.60 | £168.51 | £167.62 | £167.29 | £165.48 |
| Apr 2020 | £175.20 | £168.05 | £171.81 | £173.82 | £170.63 |
| Apr 2021 | £179.60 | £178.47 | £176.10 | £172.08 | £168.81 |
| Apr 2022 | £185.15 | £174.72 | £180.51 | £186.38 | £174.20 |
| Apr 2023 | £203.85 | £192.37 | £185.02 | £196.01 | £174.32 |
| Apr 2024 | £221.20 | £198.33 | £189.84 | £212.93 | £180.58 |
| Apr 2025 | £230.25 | £201.71 | £194.39 | £222.93 | £181.59 |
Under the triple lock, the State Pension has risen 48% from £155.65 in April 2016 to £230.25 in April 2025.
If the Treasury used earnings-only rises, it would be £222.93 - about £7.30 a week less.
Under inflation-only rises, it would fall to £201.71 — more than £28 a week less.
Under a simple 2.5% rise each year, the pension would be set at £194.39 — almost £36 a week less.
And if the Government used the minimum of value in the triple lock, pensioners would be almost £49 a week – or £2,530 a year – worse off, with a State Pension of £181.59 a week.
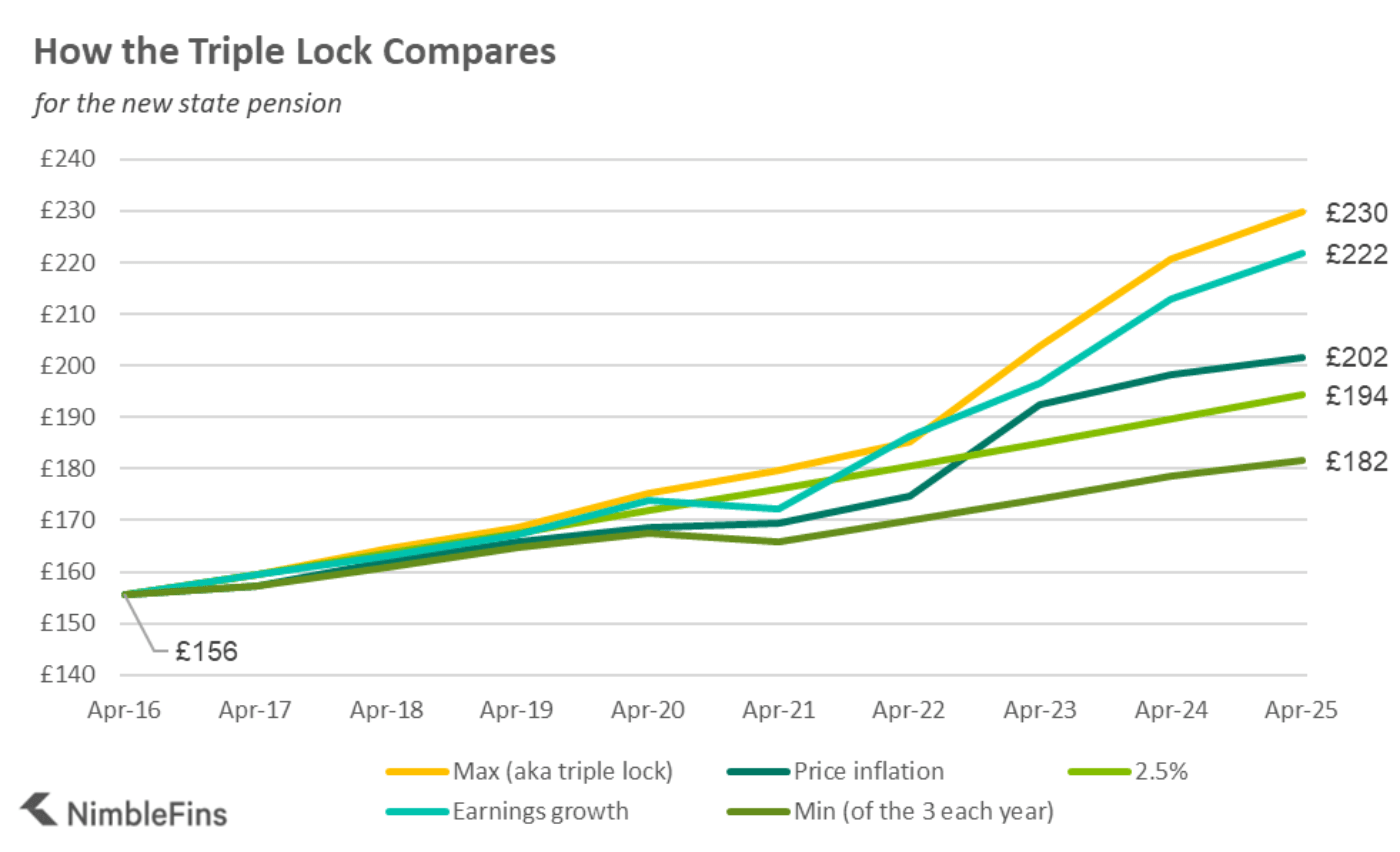
Over nine years, the triple lock has delivered thousands of pounds more for pensioners than any alternative method.
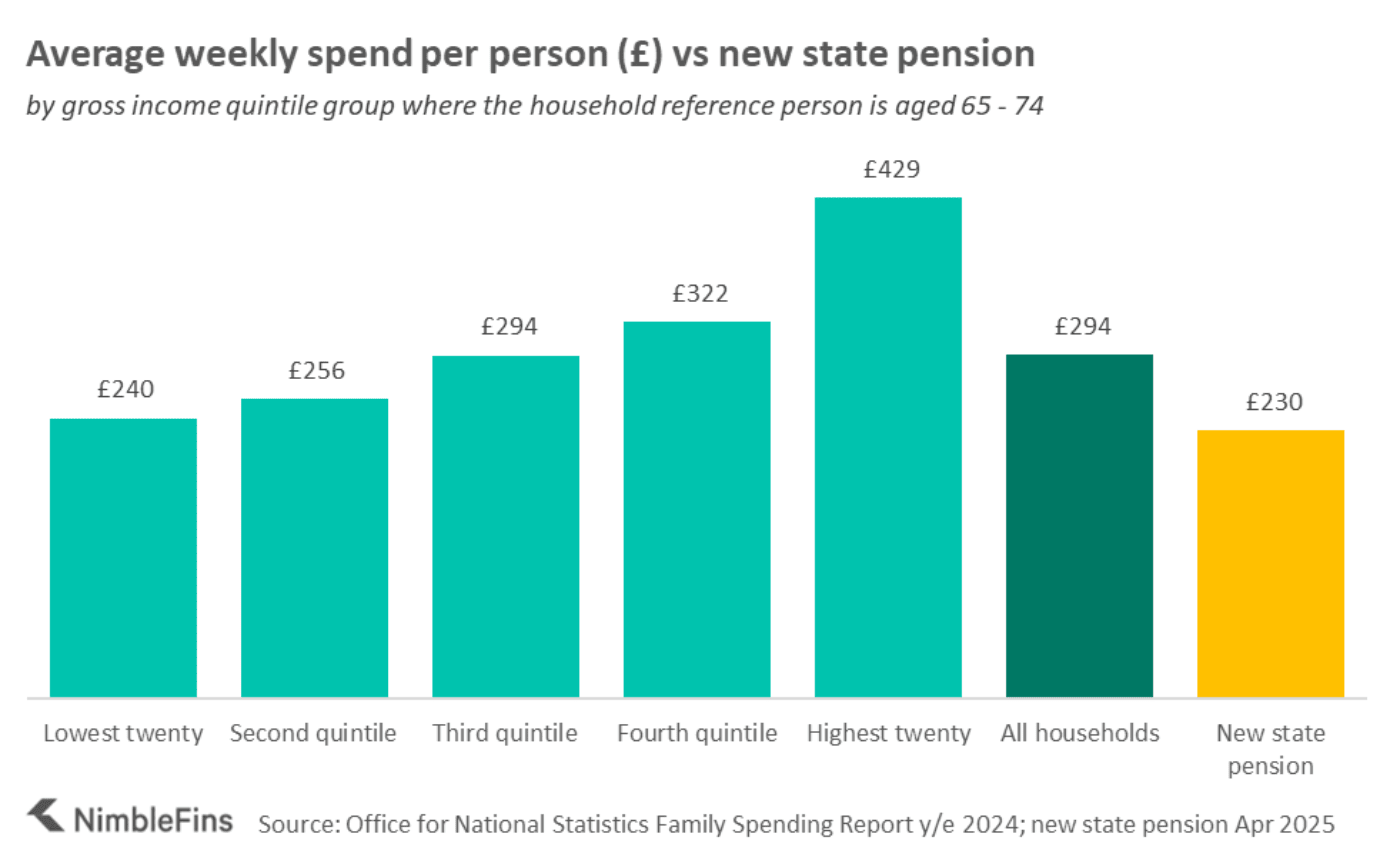
Despite the bumper rise, this chart shows the state pension compared to average spending for the 65-74 age bracket, for the five different income quintiles and the overall average.
Is pension triple lock safe in Budget?
The triple lock is expensive with each percentage point rise adding billions to Government spending. That’s why economists have long questioned whether it is sustainable.
The Chancellor will confirm this year’s final rise in the Budget.
While the Government has promised to protect pensioners, analysts warn the triple lock could still be reformed in future to cap annual rises and prevent huge jumps. They could switch to a ‘double lock’ based on inflation or earnings. But any change would be hugely unpopular and significantly affect future pension income.
Read more:
- How much money you've lost in ISAs due to inflation
- Pension tax 'disgrace' as £1bn overpaid by people withdrawing lump sum - how to claim refund
- DWP to boost state pension by £666 for rest of your life if Brits 'defer' payments - how it works
- Nearly one million people urged to act as Winter Fuel Payments cut
- Lost pensions worth £26bn could go unclaimed as one in five has missing pot - what to do