
Gold price: How much has the price of gold gone up?
The metal, which is traditionally seen as a safe haven during times of uncertainty, shattered records early in 2026 to trade at more than $5,500 an ounce.
As of February 2026, the surge is being driven by robust central bank and investor demand, alongside ongoing geopolitical tensions, as markets react to the latest global economic forecasts.
The latest jump means gold is now trading at levels never seen before, raising questions about whether the rally can continue, and how it compares with historical prices.
Why is gold price rising?
Gold tends to perform well when confidence in other markets wobbles.
In the first few weeks of 2026, gold experienced what analysts call a "speculative blow-off top". Driven by a "vaporising of trust" in the US dollar following erratic policy shifts - including tariff threats against Canada and renewed talk of acquiring Greenland - gold jumped from roughly $3,800/oz in late 2025 to a staggering record high of $5,595/oz by January 28, 2026.
This 40%+ gain in a single month was fueled by:
- Central bank panic: Massive reserve diversification away from the dollar.
- Geopolitical shocks: Military tensions in Venezuela and Iran.
- The 'tether' factor: Massive gold purchases by blockchain firms seeking a stable peg.
The bubble burst on Friday, January 30, in what was gold’s worst single-session drop since 1983. Within just a few days, gold plummeted nearly $1,200 (approx. 20%), falling from its $5,600 peak to as low as $4,402/oz.
The price did recover though and it still now trading much higher than it was in October 2025 when it was just over $4,500 an ounce.
Gold price per gram
The Royal Mint tracks live gold prices and provides historical data. At the time of writing (February 2026), the gold price per gram has shattered previous records, currently trading at approximately £117 per gram. This represents a staggering increase from just a decade ago, when the same amount cost less than £30.
To put this into perspective, in the year 2000, gold was trading at less than £6 per gram. This means its value has multiplied nearly twentyfold in just 26 years, outperforming almost every other traditional asset class in the 21st century.
Gold price chart
Data from the Royal Mint shows just how sharp the climb has been.
| Year | Price per gram (£) |
|---|---|
| 2000 | £6 |
| 2010 | £28 |
| 2020 | £48 |
| 2025 | £70+ |
| 2026 (Feb) | £117 |
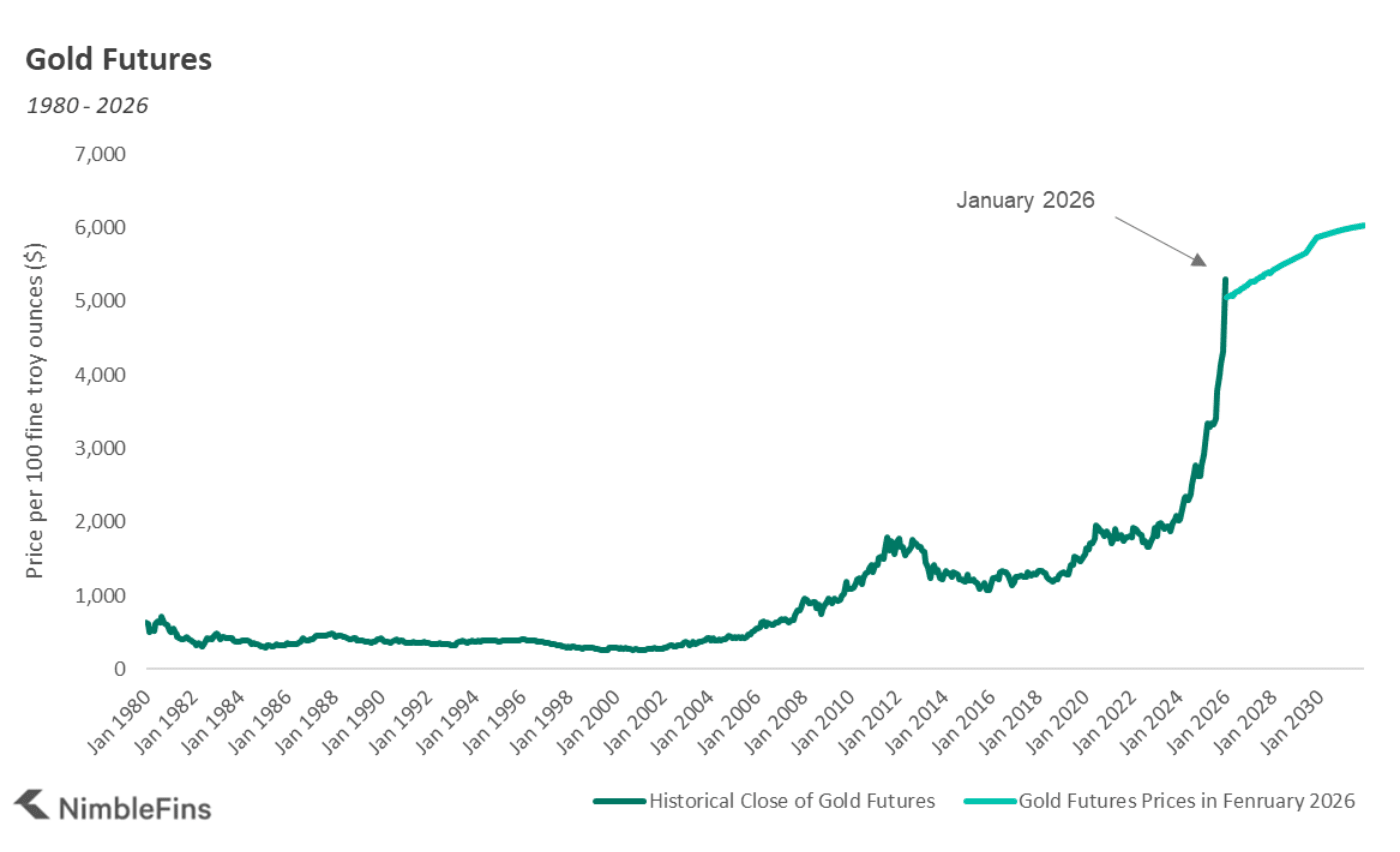
The chart demonstrates how gold rose steadily following the 2008 financial crisis, fell back slightly in the mid-2010s, and surged again during the pandemic.
However, the performance in early 2026 has been truly unprecedented. After hitting a historic peak of nearly £130 per gram in late January, the market experienced a sharp 'technical reset' - the steepest short-term drop in decades — before stabilising at the current triple-digit levels. Despite this volatility, gold remains up more than 60% year-on-year.
Gold futures prices now
JP Morgan and Deutsche Bank have forecast the price of gold to soar further and end 2026 at $6,300 an ounce. They view the recent "spike and drop" as a technical reset of an overbought market, rather than a full reversal of the long-term trend.
However, the recent price collapse serves as a stark reminder that while some investors are bullish, the path to $6,300 - if it is achieved - could be marked by further sharp, unpredictable corrections.
JP Morgan's forecast is contrary to earlier expectations of modest growth and represents a dramatic market shift, more than doubling the roughly $2,700–$2,800/oz levels seen in 2025.
As of February 2026, the gold futures market is reflecting a period of extreme volatility and high conviction. Following the 'Flash Crash' of January 2026, the futures market has stabilised into a state of contango - where future prices are higher than the spot price.
JP Morgan told Reuters its predicted 2026 rally is being underpinned by robust central bank demand and sustained investor appetite.
This aggressive institutional buying suggests gold is being viewed not just as a hedge, but as a primary growth asset in the current economic climate.
What are gold futures?
Futures contracts are agreements to buy or sell gold at a set price on a specific future date. Each contract relates to a particular month - for example, March 2026 - and the price shows what traders think gold will be worth when the contract expires at that time.
The closer the contract expiry date, the more closely the futures price typically matches today’s market price (unless a big market swing is anticipate in the near term). Longer-dated contracts, by contrast, reflect expectations about where gold could be months or years from now.
Once a contract expires, its closing price becomes the market price for that month. This makes futures markets useful for tracking historical prices as well as gauging expectations.
Can gold price go down?
Yes. While gold is often considered a safe asset, its value can and does fall. For example, if inflation eases, interest rates stay higher for longer, or investor demand weakens, gold prices could possibly fall.
History shows that gold has seen sharp corrections, such as in the early 2010s, when it fell more than 30% over three years after a strong rally.
The 'Flash Crash' of January 2026, for example, saw the price of gold tumble for various reasons, one of which was the nomination of Kevin Warsh as the next Federal Reserve Chair on January 30, which signaled a return to orthodoxy and a potentially stronger dollar, causing a mass exit from safe havens.
What this means for UK investors
For everyday savers, the record price surge is both a sign of gold’s resilience and a warning. Buying at record highs carries risk if the market cools. Experts advise viewing gold as part of a diversified portfolio, not a guaranteed money-maker.
UK investors can access gold via bullion coins and bars from the Royal Mint, or through exchange-traded funds (ETFs) that track the gold price.
Remember, profits from selling gold may be subject to Capital Gains Tax, unless the investment is held in a tax wrapper such as an ISA or SIPP.
Note: nothing in this article should be construed as investment advice. Use this information for educational purposes only, to understand historical prices and how market expectations impact futures. Gold can go up or down from here, and you can lose money investing.
Read more: