How Much Retirement Income Should I Have?
Wondering how much you need in retirement income? Us, too! To help figure it out, the NimbleFins team has dug into data from the Retirement Living Standards (RLS) to learn about how much income is recommended for 'minimum', 'moderate' and 'comfortable' levels of retirement spending.
Plus, we've dug into data from the Department for Work and Pensions (DWP) to learn about actual, real-life retirement incomes for single pensioners and pensioner couples—to see what people really have at their disposal to spend—including figures for the most and least well off. We also consider how well typical retirement incomes cover expenses.
Finally, we pull together data on average private pension pots, so you can see how your retirement savings compares to others.
- Outgoing Money: How much income do I need in retirement? 3 tiers of retirement spending
- Incoming Money: Average Retirement Income
- Average Private Pension Pots
We can't tell you how much you'll need... but we can snoop into other people's average retirement income levels. Hopefully this information will help you understand what might be required to suit your individual lifestyle so you can better enjoy your retirement...
How much income do I need in retirement?
A single person needs a minimum of £13,400 per year to live in retirement and cover the bare basics, according to the Retirement Living Standards (RLS) from Loughborough University and the Pensions and Lifetime Savings Association. A pensioner couple would need £21,600 (an additional £8,200 per year beyond a single person's spend).
A comfortable retirement spend for a single person is £43,900; and it's £60,600 for a couple (excluding rent or mortgage).
| Retirement Living Standards (excluding housing) | One person | Couple |
|---|---|---|
| Minimum | £13,400 | £21,600 |
| Moderate | £31,700 | £43,900 |
| Comfortable | £43,900 | £60,600 |

These figures don't include costs for a roof over your head, however, as they assume you own your home outright!
So how much do you need to cover retirement living expenses if you don't own your own home? Let's add in typical rent costs to the above figures, to get a rough idea of living costs for retired people who don't own their own home. Note, these are back-of-the-envelope calculations assuming people spend the typical amount on rent—but rent and mortgage costs are highly variable. Use this to just get a sense...
The median rent for those aged 65+ is £448 per month (£5,376 per year) for social housing or £639 per month (£7,668 per year) for a private rental. Let's look at both options, adding social or private rent costs to the RLS figures above. This is not an exact science, but just a rough indication to get some colour on real-life potential retirement living costs for people who don't own their own home outright.
First, we add a typical 65+ social rental cost (£5,376 per year) to the RLS guidance. As you can see, this brings the minimum retirement spend up to £18,776 per year for a single pensioner and £26,976 for a pensioner couple.
| Retirement Living Standards (including typical social rent) | One person | Couple |
|---|---|---|
| Minimum | £18,776 | £26,976 |
| Moderate | £37,076 | £49,276 |
| Comfortable | £49,276 | £65,976 |
Below, we've added a typical 65+ private rental cost (£7,668 per year) to the RLS guidance. As you can see, this brings the minimum retirement spend up to £21,068 per year for a single pensioner and £29,268 for a pensioner couple.
| Retirement Living Standards (including typical private rent) | One person | Couple |
|---|---|---|
| Minimum | £21,068 | £29,268 |
| Moderate | £39,368 | £51,568 |
| Comfortable | £51,568 | £68,268 |
A comfortable retirement spend for a single person is £51,568 including a typical private rent for those aged 65+; and it's £68,268 for a couple. But, again, some people may pay very different rent or mortgage payments.
How do these spend figures compare to the average pension income, including the State Pension? That is, do we earn enough to cover our living expenses in retirement? Let's have a look...
Average Retirement Income
According to NimbleFins analysis of data from the DWP, the average net retirement income is £19,240 per year for a single pensioner and £38,064 per year for a pensioner couple. This is the total amount of incoming money from sources like the State Pension and private pensions that pensioners have at their disposal to spend on living expenses. But 'typical' or median figures are roughly 15% lower (~£16,500 for a single pensioner and £31,000 for a pensioner couple):

Compare these figures to the three tiers of RLS (retirement spend) in the previous section—most pensioner couples barely make enough to cover the "minimum" standard of living. And single people are even worse off, with average retirement income levels well below the "minimum" standard.
Mean vs Median: Which is better? When it comes to income, the 'mean' is typically dragged upwards by a small number of very high earners—so it's not always the best metric to use, because the 'typical' person may earn less than this. Instead of using the 'mean', the 'median' can be a better representation of a 'typical' person, because the median is the point where half of people earn more and half of people earn less. Note: when it comes to income, the median is usually lower than the mean.
Single Pensioners
For single pensioners, the average (mean) retirement net income in the UK is £370 per week or £19,240 per year. That's the amount they have available to spend.
The median retirement net income in the UK is £318 per week or £16,536 per year for a single pensioner.
| Average Retirement Income for single pensioners | Per week | Per year |
|---|---|---|
| Mean Income | £370 | £19,240 |
| Median Income | £318 | £16,536 |
Pensioner Couples
For pensioner couples, the average (mean) retirement income in the UK is £732 per week or £38,064 per year.
The median retirement income in the UK is £602 per week or £31,304 per year for a pensioner couple. These median figure is roughly 15% lower than the mean figure.
| Average Retirement Income for pensioner couples | Per week | Per year |
|---|---|---|
| Mean Income | £732 | £38,064 |
| Median Income | £602 | £31,304 |
Highest and lowest retirement incomes
There's actually a really wide range of retirement incomes in the UK. To get a handle on this, we can look at median figures for each quintile of retirement income. A quintile represents a fifth, or 20%, of the group. So, for example, the bottom quintile of retirement income represents the lowest 20% of earners.
Lowest retirement incomes
The bottom fifth (lowest 20%) of single pensioner income is £177 per week or £9,204 per year in retirement income. For pensioner couples, the bottom fifth (lowest 20%) of retirement income is £332 per week or £17,264 per year.
Highest retirement incomes
At the other extreme, the top fifth (highest 20%) of single pensioner income is £577 per week or £30,004 per year in retirement income. For pensioner couples, the top fifth (highest 20%) of retirement income is £1,194 per week or £62,088 per year.
So, the top quintile receives roughly 3.3-3.6X the income of the bottom quintile—e.g. for a pensioner couple, weekly, top fifth income of £1,194 / bottom fifth income of £332 = 3.6. In other words, the top 20% can spend in a week what the bottom 20% spends in nearly a month (assuming they spend all of their income...).
| Median Retirement Net Income (weekly) | Single Pensioners | Pensioner Couples |
|---|---|---|
| Bottom fifth | £177 | £332 |
| Next fifth | £254 | £471 |
| Middle fifth | £318 | £602 |
| Next fifth | £408 | £790 |
| Top fifth | £577 | £1,194 |
Note, the quintile data here reflects the median net income of pensioner units by quintile of the pensioner net income distribution.
| Average Retirement Net Income (annual) | Single Pensioners | Pensioner Couples |
|---|---|---|
| Bottom fifth | £9,204 | £17,264 |
| Next fifth | £13,208 | £24,492 |
| Middle fifth | £16,536 | £31,304 |
| Next fifth | £21,216 | £41,080 |
| Top fifth | £30,004 | £62,088 |

For interest, compare these retirement income figures to the median salary in the UK. The median salary for full-time employees in 2025 was £751 weekly or £39,039 per year—but this is pre-tax, not net of taxes. If we use the Gov tax calculator, a salary of £39,039 is around £31,629 after tax (or £608 per week after tax). That means that the typical single pensioner retirement income of £16,536 is 48% less than the typical after-tax, full-time salary. And even the top 20% of pensioners receive net income (£30,004/year) that is less than the typical full-time salary.
Is typical retirement income enough?
Let's compare these retirement income stats to the RLS spend figures.
Yes, the typical person has enough income in retirement to meet the "minimum" RLS expenditure estimates. For example, the median retirement income for a single person in £16,536, which is more than the £13,400 needed to live at a minimmum, according to the RLS. But as we mentioned above, those RLS figures assume home ownership, so anyone with rent or a mortgage to pay will likely have a different economic result.
The top fifth of couples just earn enough from State Pensions, private pensions, etc. to meet the "comfortable" RLS standard (£60,600, if you own your home outright); the top fifth of single pensioners, however, have incomes not only below the "comfortable" RLS standard (£43,900) but also below the "moderate" RLS spend level (£31,700).
| Retirement Finances Recap (Incoming vs. Outgoing) | One person | Couple | |
|---|---|---|---|
| Retirement Income Metrics | |||
| Bottom fifth | £9,204 | £17,264 | |
| Median Retirement Income | £16,536 | £31,304 | |
| Mean Retirement Income | £19,240 | £38,064 | |
| Top fifth | £30,004 | £62,088 | |
| Retirement Expenditure Metrics | |||
| Minimum RLS | £13,400 | £21,600 | |
| Moderate RLS | £31,700 | £43,900 | |
| Comfortable RLS | £43,900 | £60,600 | |

What is a good monthly retirement income UK?
How long is a piece of string? Whether or not a specific amount of retirement income is 'good' for you, or not, depends on many factors, like where you live, if you own your home outright, what your typical living expenses are, etc. So we can't really say what a 'good' retirement income is for you.
But... it can help to compare your retirement income to the Retirement Living Standards (RLS)—above—which show how much someone may spend at retirement across three different living standards (minimum, moderate and comfortable). The RLS are estimates of expenditure, not income, but show how much someone might need to live according to a certain standard. If you have enough monthly retirement income to meet the RLS figures, perhaps that is "good"?
The RLS are published by the Pensions and Lifetime Savings Association and based on independent research by Loughborough University. Note: the RLS assume you own your own home with no mortgage, so you may need to add other costs like rent or mortgage payments if they apply to you.
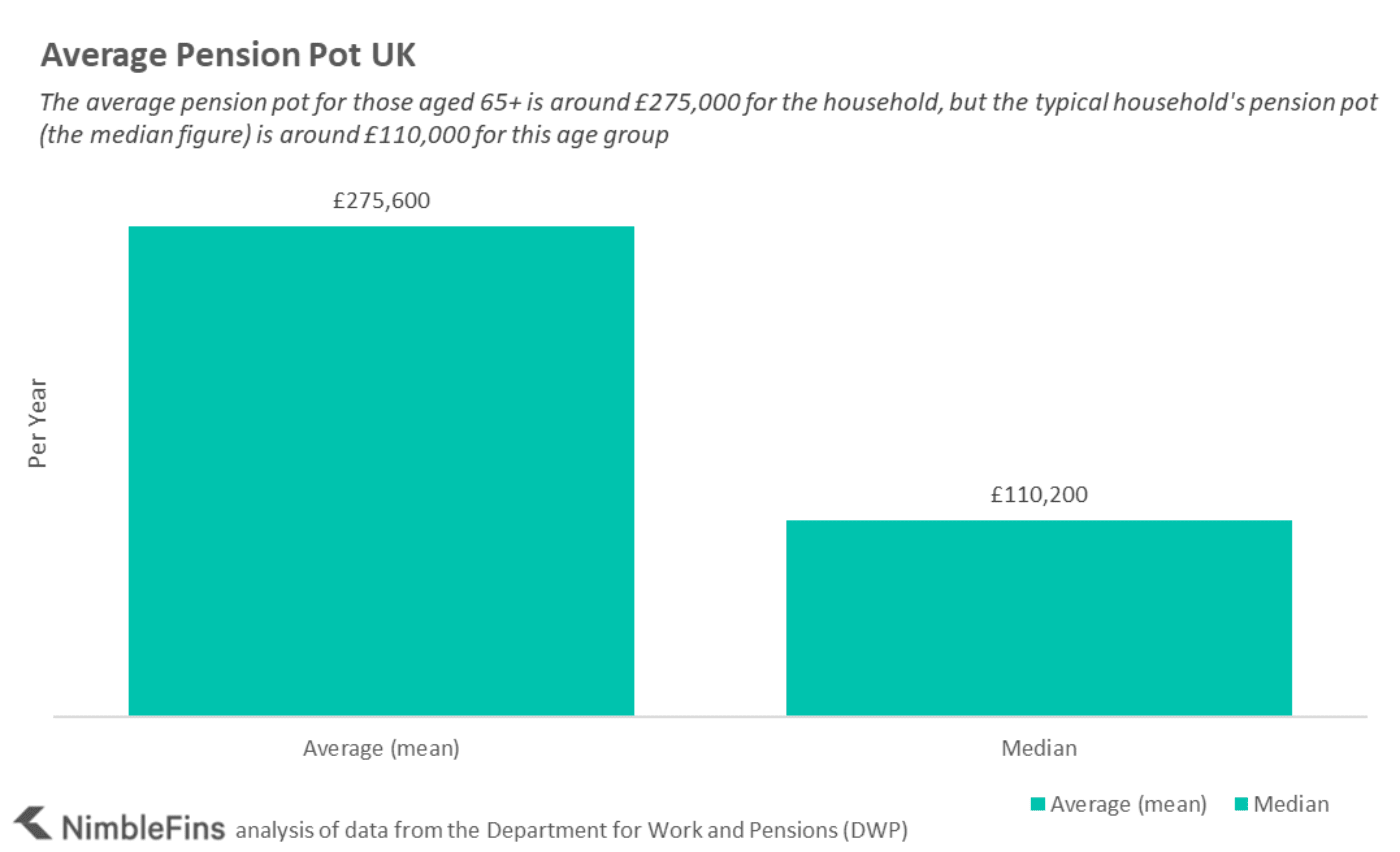
Average pension pot UK
For those of retirement age (i.e. 65+), the average (mean) private pension pot in the UK is £275,600—for the household (not per person). This includes occupational pensions, personal pensions, retained rights in previous pensions and pensions in payment.
The median private pension pot per household in the UK for this 65+ age group is quite a bit lower at £110,200. That means the 'typical' British household has around £110,000 in a private pension pots when they're in their retirement years. The mean is much higher than the median because of a small number of people with very large pension pots—most people (as indicated by the median) have less...
| Private pension wealth | |
|---|---|
| Average (mean) | £275,600 |
| Median | £110,200 |
Average pension pot UK by age
Below you can see average (mean) pension pots for different age groups. Across the board, older people have larger pension pots. Not surprising, really!
| Average (mean) private pension wealth by age | Per adult | Per household |
|---|---|---|
| 16 to 24 | £6,719 | £12,900 |
| 25 to 34 | £13,090 | £23,300 |
| 35 to 44 | £25,500 | £45,900 |
| 45 to 54 | £39,231 | £81,600 |
| 55 to 64 | £73,700 | £147,400 |
| 65 to 74 | £144,188 | £230,700 |
| 75+ | £193,125 | £309,000 |
| All households | £224,784 | £417,900 |