Which Areas of England and Wales Have the Most Energy Efficient Housing?
Table of Contents
- Top 50 Local Authorities with Most Energy Efficient Housing in England and Wales
- Which regions have the most energy efficient housing?
- Regional breakdowns
- Methodology
With average household energy bills costing around £1,300 a year, energy efficiency is a priority for homes these days. But which regions and neighborhoods in England and Wales have the most energy efficient housing? To find out which local areas have the most energy efficient homes we analysed recently-released data from the Office for National Statistics. Here's what we found.
| Housing in England & Wales | Median Energy Efficiency Scores |
|---|---|
| Flats | 70 |
| Houses | 64 |
| Weighted Average | 65.6 |
Top 50 Local Authorities with Most Energy Efficient Housing in England and Wales
Tower Hamlets in London tops the charts with the most energy efficient homes in England and Wales, sporting a weighted average median energy efficiency score of 71.9—this is 9.5% higher than the average of 65.6 across England and Wales. City of London ranked second with a score of 69.9, followed by Milton Keynes in the South East with a score of 69.2. Two local authorities in the North West rounded out the top 5, with Salford and Knowsley scoring 69.1 and 69.0, respectively.
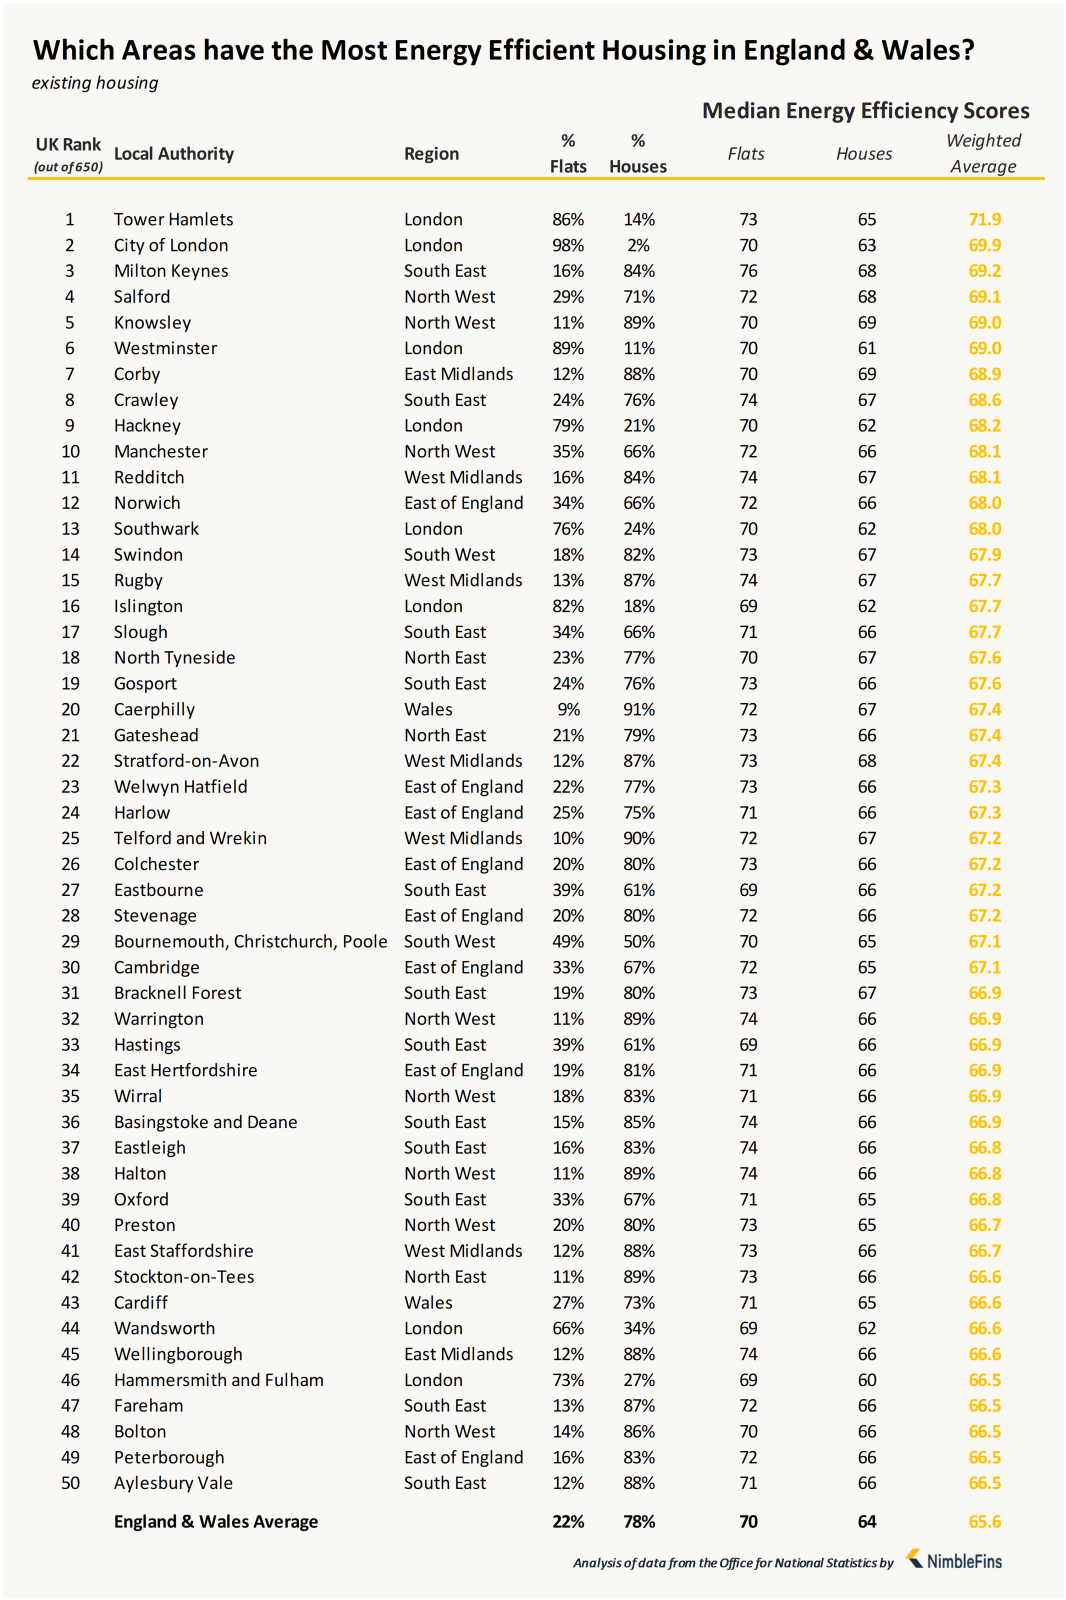
The South East shows widespread focus on energy efficient, having the most local authorities in the top 50 list (12 areas). The North West, London and East of England each had 8 local authorities in the top 50. Yorkshire and the Humber was the only region that didn't have a single region score high enough the make the top 50 list.
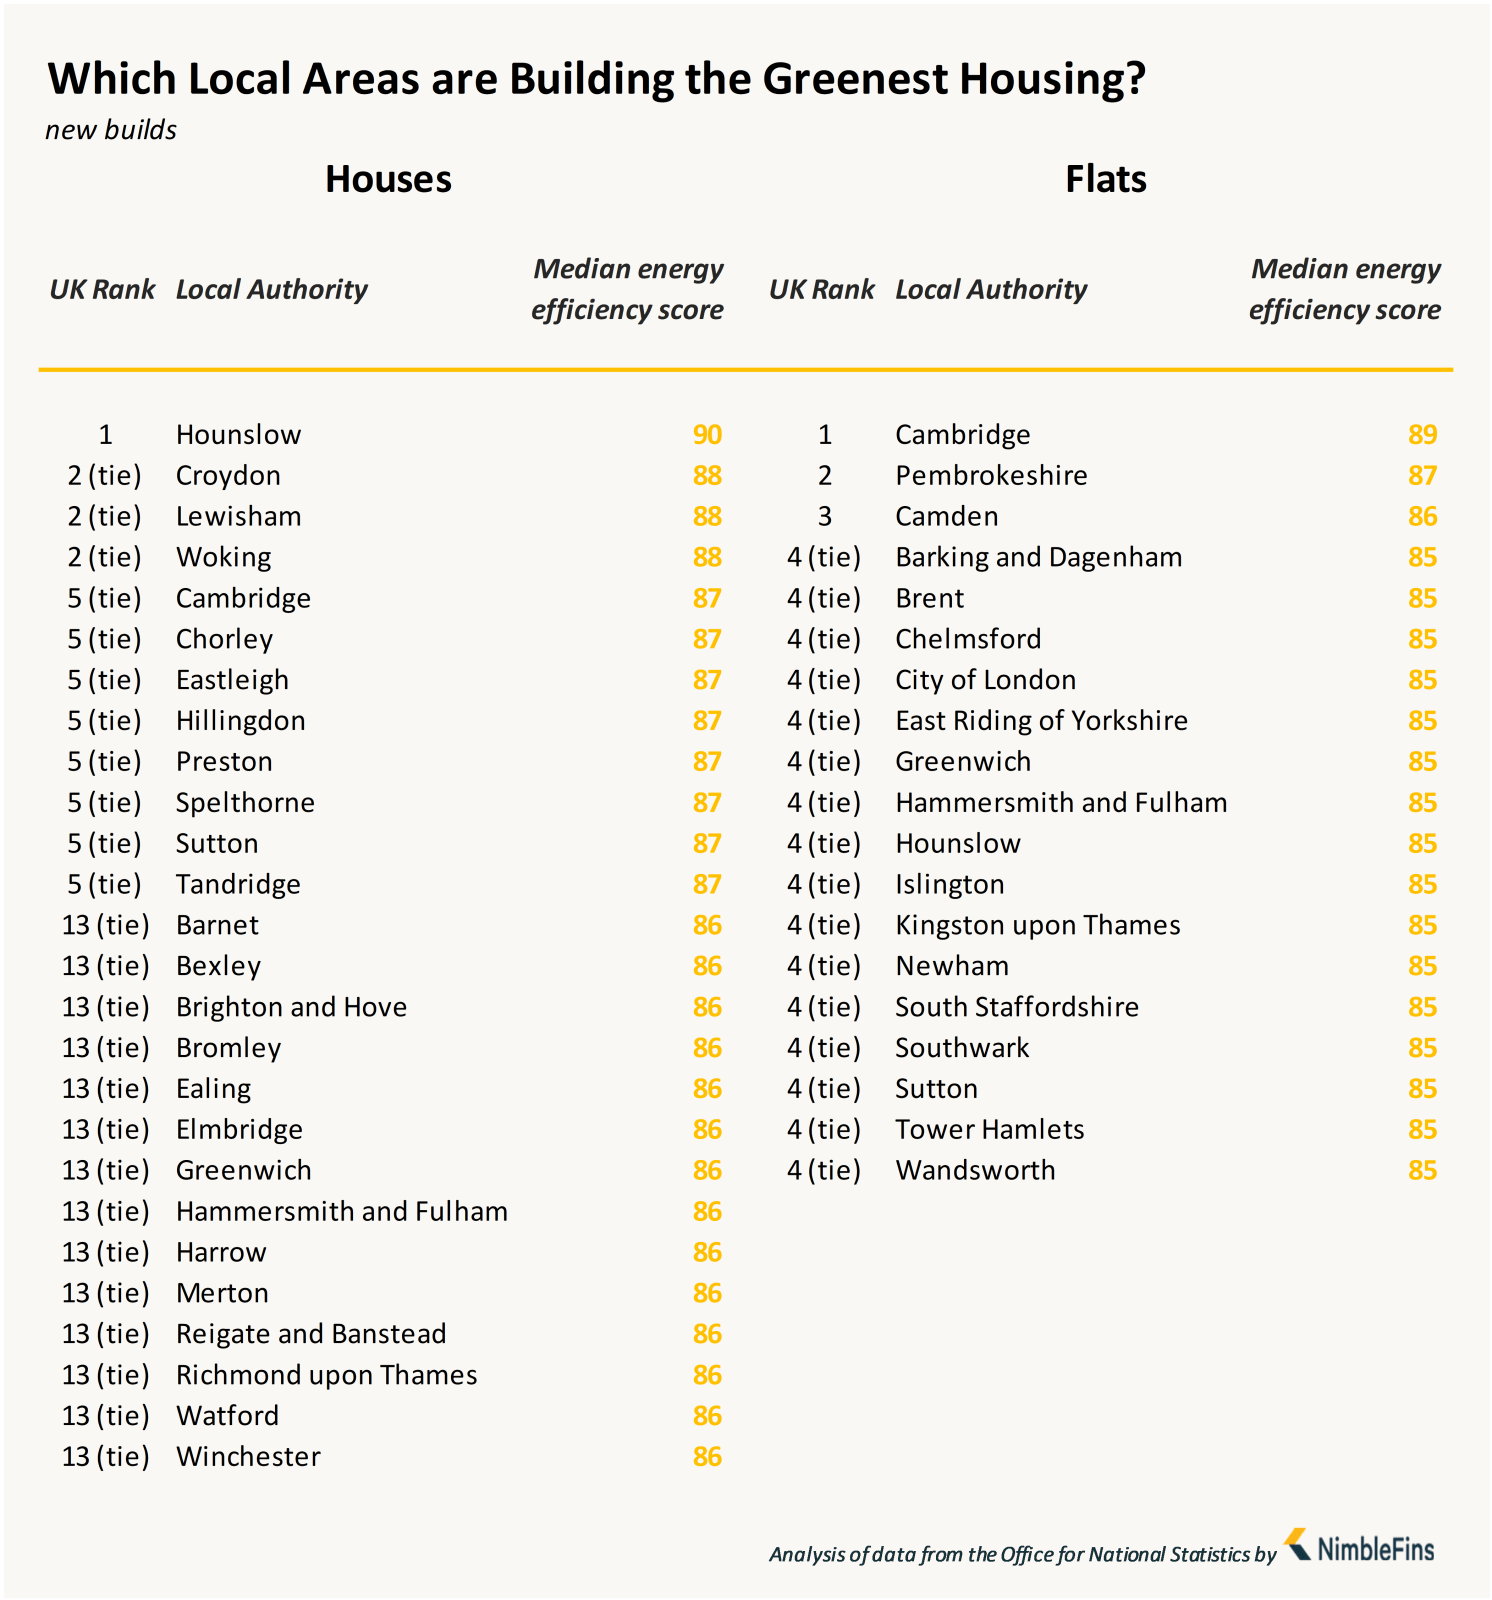
New Builds
While new builds only add around 0.8% to the housing stock a year so have a small impact on the overall housing situation, some local areas are clearly better at prioritising energy efficiency in new homes, whether they're houses or flats. New builds are built to be more efficient than existing stock, but which local areas are the best at building new homes that are the most energy efficient?
Houses. Hounslow in London ranked 1st with a median energy efficiency score of 90 on new build houses, which is a whopping 40% higher than the average for existing houses in England and Wales. Croydon (London), Lewisham (London) and Woking (South East) tied for 2nd place with an average score of 88 for new houses.
Flats. Cambridge, Pembrokeshire and Camden topped the charts for having the most energy efficient new-build flats in England and Wales, with median energy efficiency sores of 89, 87 and 86.
What's remarkable about these figures is that the top scores by geography show better energy efficiency scores for new houses compared to new flats—this is contrary to the stats for existing stock, where the energy efficiency of existing houses is around 8% worse than that of existing flats.
Which Regions have the Most Energy Efficient Housing?
The North West returned the best record for energy efficient housing in England and Wales, with a median energy efficiency score of 66.0 across all stock (calculated using the weighted average across flats and houses)—despite the existing stock in the region having a larger proportion of houses compared to flats.
The North East ranked as the 2nd best region with a median energy efficiency score of 65.8, followed by London with a score of 65.7.
The region ranking the worst was the South West, where the median energy efficiency score was just 63.1.
| Rank | Region | % Flats | % Houses | Median Energy Efficiency Scores | ||
|---|---|---|---|---|---|---|
| Flats | Houses | Weighted Average | ||||
| 1 | North West | 16% | 84% | 71 | 65 | 66.0 |
| 2 | North East | 15% | 85% | 70 | 65 | 65.8 |
| 3 | London | 52% | 48% | 69 | 62 | 65.7 |
| 4 | South East | 21% | 79% | 69 | 64 | 65.1 |
| 5 | East of England | 16% | 84% | 70 | 64 | 65.0 |
| 6 | West Midlands | 16% | 84% | 70 | 64 | 65.0 |
| 7 | Yorkshire and The Humber | 15% | 85% | 70 | 63 | 64.1 |
| 8 | Wales | 13% | 87% | 70 | 63 | 63.9 |
| 9 | East Midlands | 12% | 88% | 70 | 63 | 63.8 |
| 10 | South West | 19% | 81% | 68 | 62 | 63.1 |
| England & Wales Average | 22% | 78% | 70 | 64 | 65.6 | |
Regional Breakdowns
Now let's look at the best performing local authorities within each region of England and Wales.
East Midlands
In the East Midlands, Corby is the clear winner as the local authority with the most energy efficient housing with a score of 68.9, which was 8.0% higher than the regional average. In all of England and Wales, this result was also 5% higher than average and good enough to take the 7th spot overall.
Wellingborough, Northampton, Kettering and Chesterfield rounded out the top 5 local authorities with the most energy efficient housing, with scores ranging from 65.5 to 66.6. The worst areas in the region were Erewash, Melton, North West Leicestershire, East Lindsey and Derbyshire Dales, where the Derbyshire Dales ranked last with a score of just 57.9 (12% worse than the England and Wales average of 65.6).

East
In the East of England, Norwich (which has a high proportion of flats) ranked as the best local authority for having the most energy efficient housing, with a score of 68.0, which was 3 points or 4.6% higher than the regional average of 65.0. Norwich also ranked 12th in all of England and Wales. The rest of the top 5 is composed of Welwyn Hatfield, Harlow, Colchester and Stevenage, with scores ranging from 67.3 down to 67.2.
The worst local area for energy efficient housing in the East is King's Lynn and West Norfolk, with a score of just 56.7 (13.7% worse than the England and Wales average and ranking a poor 333 out of 339 overall). Tendring, Maldon, Castle Point and North Norfolk also scored poorly, all with scores under 60.5.

London
The two best-ranking local authorities in the capital also claimed the top 2 spots in all of England and Wales: Tower Hamlets and City of London, with scores of 71.9 and 69.9, respectively. Tower Hamlets, whose score was 9.5% higher than the overall average, was the only local authority in all of England and Wales to achieve a score over 70. Westminster, Hackney and Southwark are fared well with scores between 69.0 and 68.0.
At the other end of the spectrum, local authorities with higher proportions of houses (v.s flats) scored the worst—Richmond upon Thames, Kingston upon Thames, Havering, Harrow and Bromley only achieved scores with a 63 handle. Bromley was the worst, with a score of 63.0 (ranking 243 out of 339 in England and Wales).

North East
North Tyneside ranked best in the North East, with a median energy efficiency score of 67.6, which is 3% higher than the average in England and Wales. County Durham is notable for ranking 3rd in the region despite having the highest proportion of houses, which are generally less energy efficient, compared to flats (94% vs. 6%). Gateshead, Stockton-on-Tees and Newcastle complete the top 5, all achieving scores of at least 66.0.
The worst local areas in the region for having energy efficient housing were Middlesbrough, Sunderland, Northumberland, Darlington and Redcar & Cleveland. The lowest score was in Redcar & Cleveland, which ranked just 216 in all of England and Wales with a score of 63.5.

North West
While the North West scored as the best region overall, energy efficiency scores in the area are highly variable. The best 5 areas (Salford, Knowsley, Manchester, Warrington and Wirral) scored at least 66.9, with highest ranking Salford and Knowsley ranking 4th and 5th in the whole of England and Wales.
But the worst 5 areas (Pendle, Ribble Valley, Allerdale, South Lakeland and Eden) were among the worst in the UK, ranking from 293rd (Pendle) to 338th (Eden). Eden scored just 54.1 for energy efficiency, 17.6% worse than the average in England and Wales and ranking 338 out of 339 overall.

South East
In the South East, Milton Keynes took the #1 spot with a median energy efficiency score of 69.2, with is 5.4% higher than the average in England and Wales and helped the area achieve the 3rd spot out of 339 overall. Crawley, Slough, Gosport and Eastbourne also fared well, all achieving scores of at least 67.2.
The worst areas in the South East for having energy efficient housing were Epsom and Ewell, Mole Valley, Rother, Wycombe and Southampton, which ranked last with a score of 60.5 (ranking 310 in all of England and Wales).

South West
While the South West ranked as the worst region overall in England and Wales for energy efficient housing, there were a few bright spots. For instance, Swindon achieved a score of 67.9—this score was good enough for 14th place in all of England and Wales. Bournemouth, Christchurch & Poole also ranked in the top 50 overall in England and Wales, but results drop off from there with Exeter, South Gloucestershire and Plymouth rounded out the top 5 with scores between 66.1 and 64.9.
Forest of Dean (score of 56.4) had the lowest energy efficiency score in all of the South West, and one of the lowest in all of England and Wales (ranking 336 out of 339 overall). Cotswolds, Cornwall, Torridge and West Devon also fared poorly, all with scores below 60.

Wales
Wales also has quite a wide spread of results, with Caerphilly and Cardiff achieving top 50 spots overall in England and Wales. Caerphilly notably has a very high proportion of houses compared to flats (91% vs. 9%) but still took the top spot in Wales overall. Torfaen, Wrexham and Vale of Glamorgan rounded out the top 5, with scores of at least 65.7.
At the other end of the spectrum, Pembrokeshire, Carmarthenshire, Powys, Ceredigion and Gwynedd all scored under 60, with Gwynedd ranking last in all of England and Wales with an energy efficiency score of just 65.6, which is 18.3% lower than average.

West Midlands
The West Midlands sported 5 local authorities with scores high enough the earn a spot in the top 50 in England and Wales overall. Redditch was the best, with an energy efficiency score of 68.1 across houses and flats. Rugby, Stratford-on-Avon, Telford & Wrekin and East Staffordshire followed, with scores of at least 66.7.
Malvern Hills was the worst local authority in the West Midlands for energy efficiency—the only area scoring under 60 in the region. Shropshire, Staffordshire Moorlands, Wyre Forest and Herefordshire also returned relatively poor scores, ranging from 62.4 down to 60.4.

Yorkshire and the Humber
While no local authorities from Yorkshire and the Humber achieved scores high enough to make it into the top 50 overall in England and Wales, the region nonetheless has a winner for most energy efficient housing—Sheffield achieved a score of 66.0 which earned the 65th spot out of 339 overall and was just 0.5% higher than the England and Wales average.
Scarborough was one of the worst areas, despite having a high proportion of flats (which usually score better). The worst area in the region was Ryedale, which ranked 334 out of 339 in England and Wales with a score of just 56.6.

Methodology
In order to identity the areas in England and Wales with the most energy efficient housing, we analysed housing energy efficiency data as well as data on housing stock (i.e., number of houses and flats in each local authority) requested from the Office for National Statistics.
To calculate the median energy efficiency score for each local authority, we first used the housing stock data to determine the proportion of houses and flats in each area. Then we used these proportions to calculate a weighted average/overall energy efficiency figure for each area. For example:
| Tower Hamlets | Flats | Houses |
|---|---|---|
| Proportion of housing stock | 86% | 14% |
| Median energy efficiency score | 73 | 65 |
| Weighted average score for Tower Hamlets | (86% x 73) + (14% x 65) = 71.9 | |
Data
Here is the data for all local authorities in England and Wales, ordered alphabetically so you can find your local area and see how it compares.
| Regional Rank | UK Rank | Local Authority | % Flats | % Houses | Median Energy Efficiency Scores | ||
|---|---|---|---|---|---|---|---|
| Existing flats | Existing houses | Weighted average | |||||
| 38 | 168 | Adur | 22% | 77% | 68 | 64 | 64.3 |
| 37 | 314 | Allerdale | 9% | 91% | 66 | 60 | 60.3 |
| 34 | 280 | Amber Valley | 7% | 93% | 69 | 62 | 62.3 |
| 50 | 230 | Arun | 22% | 76% | 65 | 64 | 63.3 |
| 23 | 231 | Ashfield | 8% | 92% | 66 | 63 | 63.3 |
| 34 | 159 | Ashford | 11% | 88% | 73 | 64 | 64.4 |
| 12 | 50 | Aylesbury Vale | 12% | 88% | 71 | 66 | 66.5 |
| 38 | 295 | Babergh | 7% | 93% | 70 | 61 | 61.6 |
| 18 | 140 | Barking and Dagenham | 30% | 70% | 69 | 63 | 64.8 |
| 21 | 167 | Barnet | 43% | 57% | 69 | 61 | 64.3 |
| 3 | 91 | Barnsley | 8% | 92% | 73 | 65 | 65.6 |
| 28 | 240 | Barrow-in-Furness | 11% | 88% | 69 | 63 | 63.1 |
| 19 | 142 | Basildon | 17% | 83% | 70 | 64 | 64.8 |
| 8 | 36 | Basingstoke and Deane | 15% | 85% | 74 | 66 | 66.9 |
| 27 | 239 | Bassetlaw | 7% | 92% | 69 | 63 | 63.1 |
| 21 | 300 | Bath and North East Somerset | 22% | 78% | 64 | 61 | 61.4 |
| 14 | 125 | Bedford | 18% | 82% | 69 | 65 | 65.1 |
| 13 | 104 | Bexley | 24% | 76% | 70 | 64 | 65.4 |
| 23 | 202 | Birmingham | 25% | 75% | 69 | 62 | 63.8 |
| 18 | 169 | Blaby | 6% | 94% | 73 | 64 | 64.3 |
| 12 | 77 | Blackburn with Darwen | 12% | 88% | 73 | 65 | 65.8 |
| 30 | 249 | Blackpool | 25% | 75% | 63 | 63 | 62.9 |
| 13 | 258 | Blaenau Gwent | 10% | 90% | 69 | 62 | 62.7 |
| 10 | 118 | Bolsover | 6% | 94% | 69.5 | 65 | 65.2 |
| 8 | 48 | Bolton | 14% | 86% | 70 | 66 | 66.5 |
| 35 | 282 | Boston | 11% | 88% | 67 | 62 | 62.2 |
| 2 | 29 | Bournemouth, Christchurch and Poole | 49% | 50% | 70 | 65 | 67.1 |
| 6 | 31 | Bracknell Forest | 19% | 80% | 73 | 67 | 66.9 |
| 15 | 273 | Bradford | 16% | 84% | 71 | 61 | 62.5 |
| 22 | 163 | Braintree | 13% | 87% | 69 | 64 | 64.4 |
| 39 | 301 | Breckland | 7% | 93% | 71 | 61 | 61.4 |
| 17 | 122 | Brent | 53% | 47% | 68 | 62 | 65.2 |
| 26 | 186 | Brentwood | 21% | 79% | 69 | 63 | 64.1 |
| 8 | 141 | Bridgend | 11% | 89% | 72 | 64 | 64.8 |
| 30 | 132 | Brighton and Hove | 50% | 50% | 66 | 64 | 65.0 |
| 11 | 205 | Bristol, City of | 34% | 66% | 67 | 62 | 63.7 |
| 32 | 248 | Broadland | 5% | 95% | 71 | 63 | 63.0 |
| 33 | 243 | Bromley | 30% | 70% | 68 | 61 | 63.0 |
| 21 | 190 | Bromsgrove | 11% | 88% | 69 | 64 | 64.0 |
| 9 | 53 | Broxbourne | 25% | 75% | 71 | 65 | 66.3 |
| 31 | 255 | Broxtowe | 12% | 88% | 70 | 62 | 62.8 |
| 25 | 214 | Burnley | 9% | 91% | 71 | 63 | 63.6 |
| 20 | 134 | Bury | 14% | 86% | 71 | 64 | 64.9 |
| 1 | 20 | Caerphilly | 9% | 91% | 72 | 67 | 67.4 |
| 16 | 297 | Calderdale | 15% | 84% | 71 | 60 | 61.6 |
| 6 | 30 | Cambridge | 33% | 67% | 72 | 65 | 67.1 |
| 10 | 67 | Camden | 85% | 15% | 67 | 60 | 66.0 |
| 16 | 150 | Cannock Chase | 12% | 88% | 69 | 64 | 64.5 |
| 26 | 114 | Canterbury | 19% | 80% | 70 | 65 | 65.3 |
| 2 | 43 | Cardiff | 27% | 73% | 71 | 65 | 66.6 |
| 24 | 206 | Carlisle | 13% | 87% | 70 | 63 | 63.7 |
| 19 | 328 | Carmarthenshire | 8% | 92% | 65 | 58 | 58.2 |
| 43 | 322 | Castle Point | 9% | 88% | 66 | 61 | 59.4 |
| 16 | 130 | Central Bedfordshire | 12% | 87% | 71 | 65 | 65.1 |
| 21 | 337 | Ceredigion | 12% | 87% | 66 | 54 | 54.9 |
| 21 | 197 | Charnwood | 12% | 88% | 73 | 63 | 63.8 |
| 23 | 174 | Chelmsford | 18% | 82% | 72 | 63 | 64.2 |
| 7 | 158 | Cheltenham | 28% | 71% | 67 | 64 | 64.5 |
| 23 | 96 | Cherwell | 11% | 89% | 71 | 65 | 65.5 |
| 27 | 217 | Cheshire East | 11% | 89% | 70 | 63 | 63.5 |
| 17 | 108 | Cheshire West and Chester | 12% | 87% | 72 | 65 | 65.4 |
| 5 | 98 | Chesterfield | 13% | 87% | 70 | 65 | 65.5 |
| 55 | 256 | Chichester | 16% | 83% | 70 | 62 | 62.8 |
| 43 | 209 | Chiltern | 14% | 85% | 71 | 63 | 63.6 |
| 19 | 119 | Chorley | 10% | 90% | 71 | 65 | 65.2 |
| 2 | 2 | City of London | 98% | 2% | 70 | 63.27245509 | 69.9 |
| 4 | 26 | Colchester | 20% | 80% | 73 | 66 | 67.2 |
| 15 | 307 | Conwy | 19% | 80% | 67 | 60 | 60.9 |
| 29 | 245 | Copeland | 8% | 92% | 68 | 63 | 63.0 |
| 1 | 7 | Corby | 12% | 88% | 70 | 69 | 68.9 |
| 27 | 330 | Cornwall | 13% | 85% | 67 | 57 | 57.3 |
| 26 | 325 | Cotswold | 11% | 88% | 70 | 58 | 58.8 |
| 4 | 57 | County Durham | 6% | 94% | 71 | 66 | 66.2 |
| 7 | 59 | Coventry | 19% | 81% | 72 | 65 | 66.2 |
| 19 | 324 | Craven | 9% | 90% | 64 | 59 | 58.9 |
| 2 | 8 | Crawley | 24% | 76% | 74 | 67 | 68.6 |
| 23 | 177 | Croydon | 36% | 64% | 68 | 62 | 64.2 |
| 21 | 160 | Dacorum | 23% | 77% | 71 | 63 | 64.4 |
| 11 | 182 | Darlington | 14% | 86% | 71 | 63 | 64.1 |
| 17 | 75 | Dartford | 23% | 77% | 73 | 64 | 65.9 |
| 13 | 147 | Daventry | 7% | 93% | 73 | 64 | 64.6 |
| 16 | 313 | Denbighshire | 12% | 88% | 65 | 60 | 60.3 |
| 20 | 193 | Derby | 15% | 85% | 71 | 63 | 63.9 |
| 40 | 329 | Derbyshire Dales | 10% | 90% | 68 | 57 | 57.9 |
| 6 | 123 | Doncaster | 8% | 91% | 71 | 65 | 65.2 |
| 13 | 234 | Dorset | 13% | 86% | 71 | 63 | 63.2 |
| 54 | 254 | Dover | 17% | 81% | 69 | 63 | 62.8 |
| 14 | 148 | Dudley | 14% | 86% | 69 | 64 | 64.6 |
| 20 | 146 | Ealing | 46% | 54% | 68 | 62 | 64.6 |
| 36 | 288 | East Cambridgeshire | 7% | 92% | 69 | 62 | 62.0 |
| 14 | 267 | East Devon | 16% | 84% | 68 | 62 | 62.5 |
| 45 | 218 | East Hampshire | 14% | 85% | 70 | 63 | 63.5 |
| 7 | 34 | East Hertfordshire | 19% | 81% | 71 | 66 | 66.9 |
| 39 | 320 | East Lindsey | 10% | 88% | 66 | 60 | 59.5 |
| 11 | 120 | East Northamptonshire | 9% | 91% | 71 | 65 | 65.2 |
| 13 | 244 | East Riding of Yorkshire | 10% | 90% | 66 | 63 | 63.0 |
| 5 | 41 | East Staffordshire | 12% | 88% | 73 | 66 | 66.7 |
| 30 | 232 | East Suffolk | 10% | 89% | 69 | 63 | 63.2 |
| 5 | 27 | Eastbourne | 39% | 61% | 69 | 66 | 67.2 |
| 9 | 37 | Eastleigh | 16% | 83% | 74 | 66 | 66.8 |
| 39 | 338 | Eden | 10% | 90% | 67.5 | 53 | 54.1 |
| 25 | 113 | Elmbridge | 24% | 76% | 70 | 64 | 65.3 |
| 27 | 207 | Enfield | 38% | 62% | 68 | 61 | 63.7 |
| 29 | 224 | Epping Forest | 21% | 78% | 69 | 63 | 63.4 |
| 63 | 281 | Epsom and Ewell | 24% | 76% | 70 | 60 | 62.3 |
| 36 | 284 | Erewash | 8% | 92% | 65 | 62 | 62.2 |
| 3 | 61 | Exeter | 27% | 72% | 71 | 65 | 66.1 |
| 11 | 47 | Fareham | 13% | 87% | 72 | 66 | 66.5 |
| 28 | 196 | Fenland | 9% | 90% | 69 | 64 | 63.9 |
| 12 | 241 | Flintshire | 7% | 93% | 68 | 63 | 63.1 |
| 41 | 204 | Folkestone and Hythe | 26% | 73% | 67 | 63 | 63.7 |
| 30 | 336 | Forest of Dean | 7% | 92% | 69 | 56 | 56.4 |
| 34 | 291 | Fylde | 23% | 75% | 66 | 62 | 61.7 |
| 2 | 21 | Gateshead | 21% | 79% | 73 | 66 | 67.4 |
| 33 | 263 | Gedling | 11% | 88% | 70 | 62 | 62.6 |
| 6 | 153 | Gloucester | 18% | 82% | 64 | 65 | 64.5 |
| 4 | 19 | Gosport | 24% | 76% | 73 | 66 | 67.6 |
| 39 | 189 | Gravesham | 20% | 80% | 69 | 63 | 64.0 |
| 31 | 242 | Great Yarmouth | 15% | 84% | 69 | 63 | 63.1 |
| 11 | 87 | Greenwich | 46% | 54% | 70 | 62 | 65.7 |
| 42 | 208 | Guildford | 19% | 80% | 69 | 63 | 63.7 |
| 22 | 339 | Gwynedd | 10% | 89% | 63 | 53 | 53.6 |
| 4 | 9 | Hackney | 79% | 21% | 70 | 62 | 68.2 |
| 6 | 38 | Halton | 11% | 89% | 74 | 66 | 66.8 |
| 20 | 327 | Hambleton | 7% | 92% | 69 | 58 | 58.4 |
| 8 | 46 | Hammersmith and Fulham | 73% | 27% | 69 | 60 | 66.5 |
| 17 | 161 | Harborough | 8% | 91% | 73 | 64 | 64.4 |
| 26 | 199 | Haringey | 59% | 41% | 65 | 62 | 63.8 |
| 3 | 24 | Harlow | 25% | 75% | 71 | 66 | 67.3 |
| 14 | 264 | Harrogate | 18% | 82% | 68 | 62 | 62.6 |
| 32 | 237 | Harrow | 31% | 69% | 68 | 61 | 63.1 |
| 16 | 71 | Hart | 11% | 88% | 70.5 | 66 | 65.9 |
| 7 | 74 | Hartlepool | 13% | 87% | 73 | 65 | 65.9 |
| 7 | 33 | Hastings | 39% | 61% | 69 | 66 | 66.9 |
| 32 | 144 | Havant | 19% | 81% | 69 | 64 | 64.7 |
| 31 | 228 | Havering | 22% | 78% | 72 | 61 | 63.3 |
| 29 | 311 | Herefordshire, County of | 12% | 87% | 69 | 60 | 60.4 |
| 24 | 179 | Hertsmere | 25% | 75% | 69 | 63 | 64.2 |
| 14 | 151 | High Peak | 13% | 87% | 69 | 64 | 64.5 |
| 19 | 143 | Hillingdon | 27% | 73% | 70 | 63 | 64.8 |
| 8 | 115 | Hinckley and Bosworth | 9% | 91% | 71 | 65 | 65.3 |
| 58 | 262 | Horsham | 17% | 82% | 68 | 62 | 62.6 |
| 16 | 111 | Hounslow | 43% | 57% | 70 | 62 | 65.3 |
| 12 | 82 | Huntingdonshire | 10% | 89% | 68 | 66 | 65.8 |
| 31 | 266 | Hyndburn | 9% | 90% | 71 | 62 | 62.5 |
| 10 | 60 | Ipswich | 25% | 75% | 73 | 64 | 66.2 |
| 17 | 318 | Isle of Anglesey | 8% | 92% | 75 | 59 | 59.6 |
| 44 | 210 | Isle of Wight | 21% | 78% | 68 | 63 | 63.6 |
| 18 | 290 | Isles of Scilly | 29% | 71% | 76 | 56 | 61.7 |
| 6 | 16 | Islington | 82% | 18% | 69 | 62 | 67.7 |
| 14 | 107 | Kensington and Chelsea | 83% | 17% | 67 | 58 | 65.4 |
| 4 | 80 | Kettering | 13% | 87% | 72 | 65 | 65.8 |
| 45 | 333 | King's Lynn and West Norfolk | 9% | 85% | 71 | 59 | 56.7 |
| 5 | 103 | Kingston upon Hull, City of | 17% | 83% | 68 | 65 | 65.4 |
| 30 | 227 | Kingston upon Thames | 38% | 62% | 67 | 61 | 63.3 |
| 9 | 173 | Kirklees | 13% | 87% | 73 | 63 | 64.2 |
| 2 | 5 | Knowsley | 11% | 89% | 70 | 69 | 69.0 |
| 12 | 99 | Lambeth | 73% | 27% | 67 | 61 | 65.5 |
| 33 | 283 | Lancaster | 17% | 82% | 66 | 62 | 62.2 |
| 12 | 222 | Leeds | 22% | 78% | 69 | 62 | 63.5 |
| 28 | 246 | Leicester | 23% | 77% | 67 | 62 | 63.0 |
| 40 | 195 | Lewes | 19% | 81% | 69 | 63 | 63.9 |
| 15 | 110 | Lewisham | 55% | 45% | 68 | 62 | 65.3 |
| 11 | 100 | Lichfield | 12% | 88% | 72 | 65 | 65.4 |
| 7 | 106 | Lincoln | 20% | 80% | 71 | 64 | 65.4 |
| 9 | 56 | Liverpool | 25% | 75% | 70 | 65 | 66.2 |
| 27 | 191 | Luton | 22% | 78% | 68 | 63 | 64.0 |
| 33 | 154 | Maidstone | 16% | 83% | 71 | 64 | 64.5 |
| 42 | 317 | Maldon | 9% | 90% | 69 | 60 | 59.9 |
| 30 | 321 | Malvern Hills | 13% | 85% | 68 | 59 | 59.4 |
| 3 | 10 | Manchester | 35% | 66% | 72 | 66 | 68.1 |
| 6 | 102 | Mansfield | 10% | 90% | 71 | 65 | 65.4 |
| 35 | 162 | Medway | 15% | 84% | 70 | 64 | 64.4 |
| 37 | 294 | Melton | 8% | 92% | 71 | 61 | 61.6 |
| 16 | 272 | Mendip | 12% | 87% | 68 | 62 | 62.5 |
| 7 | 112 | Merthyr Tydfil | 7% | 93% | 71.5 | 65 | 65.3 |
| 24 | 181 | Merton | 38% | 62% | 68 | 62 | 64.1 |
| 17 | 274 | Mid Devon | 10% | 90% | 70 | 62 | 62.5 |
| 40 | 305 | Mid Suffolk | 6% | 94% | 70 | 61 | 61.1 |
| 31 | 139 | Mid Sussex | 19% | 81% | 70 | 64 | 64.8 |
| 8 | 81 | Middlesbrough | 14% | 86% | 71 | 65 | 65.8 |
| 1 | 3 | Milton Keynes | 16% | 84% | 76 | 68 | 69.2 |
| 64 | 285 | Mole Valley | 20% | 78% | 69 | 62 | 62.1 |
| 11 | 221 | Monmouthshire | 10% | 89% | 70 | 63 | 63.5 |
| 14 | 268 | Neath Port Talbot | 11% | 89% | 68 | 62 | 62.5 |
| 56 | 257 | New Forest | 14% | 84% | 69 | 63 | 62.8 |
| 19 | 175 | Newark and Sherwood | 8% | 91% | 71 | 64 | 64.2 |
| 5 | 66 | Newcastle upon Tyne | 32% | 68% | 68 | 65 | 66.0 |
| 17 | 152 | Newcastle-under-Lyme | 11% | 89% | 69 | 64 | 64.5 |
| 9 | 55 | Newham | 47% | 53% | 70 | 63 | 66.3 |
| 6 | 93 | Newport | 18% | 82% | 69 | 65 | 65.6 |
| 24 | 315 | North Devon | 16% | 83% | 64 | 60 | 60.2 |
| 24 | 235 | North East Derbyshire | 6% | 93% | 71 | 63 | 63.2 |
| 11 | 212 | North East Lincolnshire | 13% | 87% | 68 | 63 | 63.6 |
| 25 | 183 | North Hertfordshire | 19% | 81% | 71 | 63 | 64.1 |
| 22 | 198 | North Kesteven | 4% | 95% | 73 | 64 | 63.8 |
| 10 | 187 | North Lincolnshire | 10% | 90% | 69 | 64 | 64.0 |
| 44 | 326 | North Norfolk | 10% | 89% | 67 | 58 | 58.5 |
| 15 | 269 | North Somerset | 20% | 79% | 64 | 63 | 62.5 |
| 1 | 18 | North Tyneside | 23% | 77% | 70 | 67 | 67.6 |
| 22 | 200 | North Warwickshire | 9% | 91% | 65 | 64 | 63.8 |
| 38 | 296 | North West Leicestershire | 7% | 92% | 63 | 62 | 61.6 |
| 3 | 51 | Northampton | 18% | 82% | 73 | 65 | 66.4 |
| 10 | 155 | Northumberland | 11% | 89% | 70 | 64 | 64.5 |
| 1 | 12 | Norwich | 34% | 66% | 72 | 66 | 68.0 |
| 9 | 117 | Nottingham | 25% | 75% | 72 | 63 | 65.2 |
| 15 | 149 | Nuneaton and Bedworth | 13% | 87% | 71 | 64 | 64.6 |
| 15 | 156 | Oadby and Wigston | 8% | 92% | 69 | 64 | 64.5 |
| 13 | 79 | Oldham | 13% | 87% | 72 | 65 | 65.8 |
| 10 | 39 | Oxford | 33% | 67% | 71 | 65 | 66.8 |
| 18 | 319 | Pembrokeshire | 12% | 87% | 70 | 59 | 59.5 |
| 35 | 293 | Pendle | 8% | 92% | 70 | 61 | 61.6 |
| 8 | 49 | Peterborough | 16% | 83% | 72 | 66 | 66.5 |
| 5 | 135 | Plymouth | 26% | 74% | 68 | 64 | 64.9 |
| 21 | 88 | Portsmouth | 35% | 65% | 69 | 64 | 65.7 |
| 20 | 335 | Powys | 9% | 90% | 66 | 56 | 56.4 |
| 7 | 40 | Preston | 20% | 80% | 73 | 65 | 66.7 |
| 28 | 127 | Reading | 32% | 68% | 70 | 63 | 65.1 |
| 22 | 176 | Redbridge | 32% | 68% | 69 | 62 | 64.2 |
| 12 | 216 | Redcar and Cleveland | 10% | 90% | 69 | 63 | 63.5 |
| 1 | 11 | Redditch | 16% | 84% | 74 | 67 | 68.1 |
| 13 | 54 | Reigate and Banstead | 25% | 74% | 72 | 65 | 66.3 |
| 9 | 170 | Rhondda Cynon Taf | 8% | 91% | 69 | 64 | 64.3 |
| 36 | 303 | Ribble Valley | 8% | 91% | 72.5 | 61 | 61.2 |
| 29 | 225 | Richmond upon Thames | 41% | 59% | 67 | 61 | 63.4 |
| 17 | 306 | Richmondshire | 7% | 92% | 70 | 61 | 61.1 |
| 11 | 73 | Rochdale | 15% | 85% | 72 | 65 | 65.9 |
| 33 | 260 | Rochford | 11% | 88% | 69 | 63 | 62.6 |
| 26 | 215 | Rossendale | 11% | 89% | 70 | 63 | 63.6 |
| 65 | 286 | Rother | 23% | 77% | 67 | 61 | 62.0 |
| 4 | 92 | Rotherham | 11% | 89% | 71 | 65 | 65.6 |
| 2 | 15 | Rugby | 13% | 87% | 74 | 67 | 67.7 |
| 53 | 251 | Runnymede | 21% | 75% | 69 | 64 | 62.9 |
| 29 | 252 | Rushcliffe | 11% | 89% | 66 | 63 | 62.9 |
| 14 | 58 | Rushmoor | 26% | 74% | 71 | 65 | 66.2 |
| 25 | 236 | Rutland | 8% | 92% | 70 | 63 | 63.2 |
| 21 | 334 | Ryedale | 7% | 92% | 67.5 | 56 | 56.6 |
| 1 | 4 | Salford | 29% | 71% | 72 | 68 | 69.1 |
| 19 | 180 | Sandwell | 19% | 81% | 69 | 63 | 64.1 |
| 18 | 308 | Scarborough | 25% | 74% | 64 | 60 | 60.8 |
| 23 | 304 | Sedgemoor | 13% | 86% | 67 | 61 | 61.1 |
| 10 | 68 | Sefton | 20% | 80% | 70 | 65 | 66.0 |
| 8 | 171 | Selby | 7% | 92% | 69.5 | 64 | 64.3 |
| 60 | 276 | Sevenoaks | 14% | 85% | 70 | 62 | 62.4 |
| 1 | 65 | Sheffield | 22% | 78% | 73 | 64 | 66.0 |
| 26 | 279 | Shropshire | 10% | 90% | 71 | 62 | 62.4 |
| 3 | 17 | Slough | 34% | 66% | 71 | 66 | 67.7 |
| 12 | 109 | Solihull | 18% | 82% | 72 | 64 | 65.3 |
| 19 | 298 | Somerset West and Taunton | 15% | 84% | 69 | 61 | 61.5 |
| 59 | 271 | South Bucks | 19% | 79% | 70 | 62 | 62.5 |
| 13 | 90 | South Cambridgeshire | 6% | 93% | 72 | 66 | 65.7 |
| 12 | 131 | South Derbyshire | 7% | 93% | 71 | 65 | 65.0 |
| 4 | 126 | South Gloucestershire | 11% | 88% | 70 | 65 | 65.1 |
| 25 | 323 | South Hams | 14% | 86% | 64 | 59 | 59.2 |
| 30 | 253 | South Holland | 5% | 95% | 68 | 63 | 62.9 |
| 26 | 238 | South Kesteven | 9% | 91% | 69 | 63 | 63.1 |
| 38 | 316 | South Lakeland | 16% | 84% | 67 | 59 | 60.0 |
| 34 | 265 | South Norfolk | 6% | 94% | 74 | 62 | 62.6 |
| 16 | 157 | South Northamptonshire | 7% | 93% | 74 | 64 | 64.5 |
| 57 | 261 | South Oxfordshire | 11% | 87% | 69 | 63 | 62.6 |
| 16 | 101 | South Ribble | 9% | 91% | 72 | 65 | 65.4 |
| 8 | 172 | South Somerset | 11% | 88% | 71 | 64 | 64.3 |
| 25 | 223 | South Staffordshire | 9% | 89% | 71 | 64 | 63.4 |
| 6 | 72 | South Tyneside | 21% | 79% | 69 | 65 | 65.9 |
| 67 | 310 | Southampton | 40% | 60% | 54 | 65 | 60.5 |
| 37 | 292 | Southend-on-Sea | 35% | 65% | 65 | 60 | 61.7 |
| 5 | 13 | Southwark | 76% | 24% | 70 | 62 | 68.0 |
| 37 | 166 | Spelthorne | 24% | 75% | 70 | 63 | 64.3 |
| 18 | 136 | St Albans | 22% | 78% | 70 | 64 | 64.9 |
| 14 | 85 | St. Helens | 9% | 91% | 73 | 65 | 65.7 |
| 18 | 164 | Stafford | 13% | 87% | 70 | 64 | 64.4 |
| 27 | 287 | Staffordshire Moorlands | 6% | 94% | 64 | 62 | 62.0 |
| 5 | 28 | Stevenage | 20% | 80% | 72 | 66 | 67.2 |
| 22 | 192 | Stockport | 16% | 84% | 69 | 63 | 64.0 |
| 3 | 42 | Stockton-on-Tees | 11% | 89% | 73 | 66 | 66.6 |
| 6 | 52 | Stoke-on-Trent | 12% | 88% | 70 | 66 | 66.4 |
| 3 | 22 | Stratford-on-Avon | 12% | 87% | 73 | 68 | 67.4 |
| 22 | 302 | Stroud | 12% | 88% | 66 | 61 | 61.3 |
| 9 | 137 | Sunderland | 14% | 86% | 71 | 64 | 64.8 |
| 20 | 84 | Surrey Heath | 16% | 83% | 72 | 65 | 65.8 |
| 25 | 184 | Sutton | 35% | 65% | 70 | 61 | 64.1 |
| 52 | 250 | Swale | 12% | 88% | 67 | 63 | 62.9 |
| 10 | 185 | Swansea | 17% | 83% | 71 | 63 | 64.1 |
| 1 | 14 | Swindon | 18% | 82% | 73 | 67 | 67.9 |
| 18 | 116 | Tameside | 16% | 85% | 72 | 64 | 65.2 |
| 10 | 95 | Tamworth | 14% | 86% | 71 | 65 | 65.5 |
| 62 | 278 | Tandridge | 21% | 78% | 70 | 61 | 62.4 |
| 20 | 299 | Teignbridge | 15% | 83% | 65 | 62.5 | 61.5 |
| 4 | 25 | Telford and Wrekin | 10% | 90% | 72 | 67 | 67.2 |
| 41 | 312 | Tendring | 17% | 82% | 66 | 60 | 60.4 |
| 29 | 128 | Test Valley | 13% | 87% | 70 | 65 | 65.1 |
| 9 | 194 | Tewkesbury | 10% | 88% | 67 | 65 | 63.9 |
| 18 | 76 | Thanet | 28% | 70% | 69 | 66 | 65.9 |
| 17 | 133 | Three Rivers | 19% | 80% | 72 | 64 | 65.0 |
| 11 | 64 | Thurrock | 23% | 77% | 70 | 65 | 66.0 |
| 27 | 121 | Tonbridge and Malling | 12% | 87% | 72 | 64.5 | 65.2 |
| 10 | 203 | Torbay | 31% | 69% | 64 | 64 | 63.7 |
| 3 | 70 | Torfaen | 12% | 88% | 73 | 65 | 65.9 |
| 28 | 331 | Torridge | 11% | 89% | 64 | 57 | 57.3 |
| 1 | 1 | Tower Hamlets | 86% | 14% | 73 | 65 | 71.9 |
| 23 | 201 | Trafford | 20% | 81% | 71 | 62 | 63.8 |
| 48 | 226 | Tunbridge Wells | 26% | 74% | 68 | 62 | 63.4 |
| 35 | 270 | Uttlesford | 11% | 89% | 70 | 62 | 62.5 |
| 5 | 89 | Vale of Glamorgan | 15% | 84% | 72 | 65 | 65.7 |
| 36 | 165 | Vale of White Horse | 13% | 86% | 72 | 64 | 64.4 |
| 7 | 138 | Wakefield | 12% | 88% | 72 | 64 | 64.8 |
| 13 | 124 | Walsall | 17% | 83% | 71 | 64 | 65.1 |
| 28 | 213 | Waltham Forest | 41% | 59% | 66 | 62 | 63.6 |
| 7 | 44 | Wandsworth | 66% | 34% | 69 | 62 | 66.6 |
| 4 | 32 | Warrington | 11% | 89% | 74 | 66 | 66.9 |
| 8 | 63 | Warwick | 23% | 77% | 70 | 65 | 66.0 |
| 15 | 129 | Watford | 34% | 66% | 71 | 62 | 65.1 |
| 49 | 229 | Waverley | 17% | 83% | 71 | 62 | 63.3 |
| 51 | 247 | Wealden | 12% | 87% | 70 | 63 | 63.0 |
| 2 | 45 | Wellingborough | 12% | 88% | 74 | 66 | 66.6 |
| 2 | 23 | Welwyn Hatfield | 22% | 77% | 73 | 66 | 67.3 |
| 61 | 277 | West Berkshire | 15% | 85% | 69 | 62 | 62.4 |
| 29 | 332 | West Devon | 10% | 89% | 62 | 57 | 57.1 |
| 21 | 178 | West Lancashire | 10% | 88% | 72 | 65 | 64.2 |
| 32 | 259 | West Lindsey | 5% | 94% | 53 | 64 | 62.6 |
| 47 | 220 | West Oxfordshire | 10% | 89% | 72 | 63 | 63.5 |
| 20 | 145 | West Suffolk | 12% | 87% | 73 | 64 | 64.7 |
| 3 | 6 | Westminster | 89% | 11% | 70 | 61 | 69.0 |
| 15 | 97 | Wigan | 10% | 90% | 70.5 | 65 | 65.5 |
| 12 | 233 | Wiltshire | 11% | 88% | 68 | 63 | 63.2 |
| 22 | 94 | Winchester | 17% | 82% | 73 | 65 | 65.6 |
| 24 | 105 | Windsor and Maidenhead | 24% | 75% | 73 | 64 | 65.4 |
| 5 | 35 | Wirral | 18% | 83% | 71 | 66 | 66.9 |
| 15 | 62 | Woking | 25% | 75% | 70 | 65 | 66.1 |
| 19 | 83 | Wokingham | 11% | 88% | 70 | 66 | 65.8 |
| 20 | 188 | Wolverhampton | 22% | 78% | 68 | 63 | 64.0 |
| 9 | 69 | Worcester | 20% | 80% | 70 | 65 | 66.0 |
| 46 | 219 | Worthing | 36% | 65% | 64 | 63 | 63.5 |
| 4 | 86 | Wrexham | 11% | 88% | 73 | 65 | 65.7 |
| 24 | 211 | Wychavon | 11% | 88% | 70 | 64 | 63.6 |
| 66 | 289 | Wycombe | 19% | 80% | 67 | 61 | 61.9 |
| 32 | 275 | Wyre | 11% | 87% | 68 | 63 | 62.4 |
| 28 | 309 | Wyre Forest | 13% | 84% | 68 | 62 | 60.8 |
| 2 | 78 | York | 18% | 82% | 70 | 65 | 65.8 |